Demografía de Voivodina


Los principales datos relativos a la demografía de Voivodina son los siguientes.
Población por grupo nacional o étnico
Censo del 2002
| Number | % | |
| TOTAL | 2,031,992 | 100.00 |
| Serbios | 1,321,807 | 65.05 |
| Húngaros | 290,207 | 14.28 |
| Eslovacos | 56,637 | 2.79 |
| Croatas | 56,546 | 2.78 |
| Yugoeslavos étnicos | 49,881 | 2.45 |
| Montenegrinos | 35,513 | 1.75 |
| Romanians | 30,419 | 1.50 |
| Romani | 29,057 | 1.43 |
| Bunjevci | 19,766 | 0.97 |
| Rusyns | 15,626 | 0.77 |
| Macedonios | 11,785 | 0.58 |
| Ucranianos | 4,635 | 0.23 |
| ethnic Muslims | 3,634 | 0.18 |
| Alemanes | 3,154 | 0.16 |
| Eslovenos | 2,005 | 0.10 |
| Albanos | 1,695 | 0.08 |
| Bulgaros | 1,658 | 0.08 |
| Czechs | 1,648 | 0.08 |
| Rusos | 940 | 0.05 |
| Gorani | 606 | 0.03 |
| Bosnios | 417 | 0.02 |
| Vlachs | 101 | 0.00 |
| Otros | 5,311 | 0.26 |
| Regional identity | 10,154 | 0.50 |
| No declarado | 55,016 | 2.71 |
| Desconocido | 23,774 | 1.17 |
-
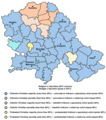
 Ethnic structure of Vojvodina by settlements 2002.
 -
 Ethnic structure of Vojvodina by settlements 2002.
 -
 Ethnic structure of Vojvodina by settlements 2002.
 -
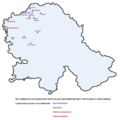
 Share of Serbs in Vojvodina by settlements 2002.
 -
 Share of Hungarians in Vojvodina by settlements 2002.
 -
 Share of Slovaks in Vojvodina by settlements 2002.
 -
 Share of Romanians in Vojvodina by settlements 2002.
 -
 Slovaks, Rusyns and Czechs in Vojvodina 2002.
 -
 Montenegrins, Bunjevci and Croats in Vojvodina 2002.
 -
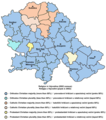
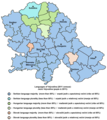
 Ethnic structure of Vojvodina by municipalities 2002.
 -
 Share of Serbs in Vojvodina by municipalities 2002.
 -
 Share of Hungarians in Vojvodina by municipalities 2002.
 -
 Linguistic structure of Vojvodina by municipalities 2002.
 -
 Religious structure of Vojvodina by municipalities 2002.


Censo del 2011
| Number | % | |
| TOTAL | 1,931,809 | 100.00 |
| Serbios | 1,289,635 | 66.76 |
| Húngaros | 251,136 | 13.00 |
| Eslovacos | 50,321 | 2.60 |
| Croatas | 47,033 | 2.43 |
| Romani | 42,391 | 2.19 |
| Romanians | 25,410 | 1.32 |
| Montenegrins | 22,141 | 1.15 |
| Bunjevci | 16,469 | 0.85 |
| Rusyns | 13,928 | 0.72 |
| Macedonians | 10,392 | 0.54 |
| Ucranianos | 4,202 | 0.22 |
| ethnic Muslims | 3,360 | 0.17 |
| Germans | 3,272 | 0.17 |
| Albanians | 2,251 | 0.12 |
| Eslovenos | 1,815 | 0.09 |
| Búlgaros | 1,489 | 0.08 |
| Gorani | 1,179 | 0.06 |
| Russians | 1,173 | 0.06 |
| Bosniaks | 780 | 0.04 |
| Vlachs | 170 | 0.01 |
| ethnic Yugoslavs | 12,176 | 0.63 |
| Otros | 6,710 | 0.35 |
| Regional identity | 28,567 | 1.48 |
| No declarados | 81,018 | 4.19 |
| Desconocido | 14,791 | 0.77 |
[1]
-
 Ethnic structure of Vojvodina by municipalities 2011.
 -
 Ethnic structure of Vojvodina by municipalities in 2011.
 -
 Share of Serbs in Vojvodina by municipalities 2011.
 -
 Share of Hungarians in Vojvodina by municipalities 2011.
 -
 Religious structure of Vojvodina by municipalities 2011.
 -
 Religious structure of Vojvodina by municipalities in 2011.
 -
 Linguistic structure of Vojvodina by municipalities 2011.
 -
 Linguistic structure of Vojvodina by municipalities in 2011.


Población por lengua materna
- 1.557.020 Serbio (76,63%)
- 284.205 Húngaro (13,99%)
- 55.065 Eslovaco (2,71%)
- 29.512 Rumano (1,45%)
- 21.939 Romaní (1,08%)
- 21.053 Croata (1,04%)
- 4.152 Macedonio
- 2.369 Albanés
- 920 Búlgaro
Población por religión
- 1.401.475 Ortodoxos (68,97%)
- 388.313 Católicos y de rito oriental (19,11%)
- 72.159 Protestantes (3,55%)
- 12.583 Ateos
- 8.073 Musulmanes
- 329 Judíos
- 166 religiones orientales (Budismo, Hinduismo etc.)
- 4.456 otras
- 418 sin afiliación religiosa
- 42.876 desconocido
- 101.144 sin responder a la encuesta
Población por género
- 984.942 hombres
- 1.047.050 mujeres
Población por grupos de edad:
- 0-14 años: 15,85% (165.332 hombres, 156.873 mujeres)
- 15-64 años: 68,62% (693.646 hombres, 700.416 mujeres)
- 65 años o más: 15,53% (125.964 hombres, 189.761 mujeres)
Notas
- ↑ Попис становништва, домаћинстава и станова 2011. у Републици Србији / 2011 Census of Population, Households and Dwellings in the Republic of Serbia, Belgrade, 2012
Bibliografía
- Oficina estadística de la República de Serbia
| Control de autoridades |
|
|---|
 Datos: Q4863675


