On November 8, the tropical depression crossed the Malay Peninsula and emerged into the Bay of Bengal. Degenerated into a low-pressure area later, it was struggling to develop until intensifying into a depression on November 13. The system made landfall over India on November 16 and caused 16 fatalities, before it weakened into a low-pressure area, and then entered the Arabian Sea on the next day.
Late on October 30, the Japan Meteorological Agency (JMA) reported that a low-pressure area had formed near Chuuk.[1] On November 1, a tropical disturbance southeast of Yap persisted within the low-pressure area, as well as JMA upgraded the system to a tropical depression east of Palau late on the same day.[2][3] However, the agency soon downgraded it back to a low-pressure only six hours later, when the system remained poorly organised with convection confined to the western flank.[4][5] Shortly after JMA upgraded it to a tropical depression near Palau again early on November 3, the Joint Typhoon Warning Center (JTWC) issued a Tropical Cyclone Formation Alert for the system.[6][7]
Only three hours later, the system was upgraded to a tropical depression and designated as 30W by JTWC, estimating it would intensify into a category 1 typhoon in the South China Sea. In post-analysis, JTWC indicated that 30W had already become a tropical depression on November 2.[2] The low-level circulation centre was partially exposed but consolidating with the bulk of deep convection sheared to the west. At that time, the tropical depression was tracking along the southern periphery of the steering subtropical ridge to the north, and vertical wind shear was weak to moderate, offset by radial outflow and a developing poleward channel.[8] Late on November 3, the Philippine Atmospheric, Geophysical and Astronomical Services Administration (PAGASA) upgraded the system to a tropical depression and gave it the local name Wilma.[9]
On November 4, Wilma made landfall over Surigao del Sur, Philippines before 04:00 UTC, and JMA began to issue tropical cyclone advisories to the tropical depression in the Bohol Sea since 06:00 UTC, expecting it to intensify into a tropical storm within 24 hours.[10][11] Soon, PAGASA downgraded Wilma to a low-pressure area at 09:00 UTC.[12] Interacting with the frictional effects by passing through the Philippines, the tropical depression still got slightly organisational improvement, and it began to accelerate westward.[13] Late on the same day, it arrived at the Sulu Sea, as well as it crossed Palawan and arrived at the South China Sea early on November 5. According to the JTWC best track data, 30W was a tropical storm at 06Z and 12Z, while the low-level circulation centre was partially exposed with the bulk of deep convection located to the north at noon.[14] Late on the same day, JTWC downgraded 30W back to a tropical depression for becoming increasingly fragmented.[15]
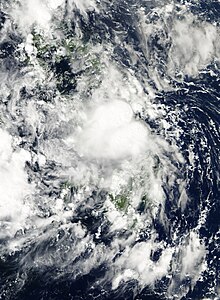
The tropical depression crossing the Malay Peninsula on November 8
On November 6, JTWC issued a final warning to 30W at 06:00 UTC, when the tropical depression began to erode further.[16] Prior to making landfall over the area near Phan Rang–Tháp Chàm, Vietnam, JMA stopped issuing any tropical cyclone advisory to the tropical depression at noon, although it still remained its 10-minute maximum sustained winds at 30 knots (55 km/h; 35 mph) briefly.[17] According to the JTWC best track data, 30W weakened into a tropical disturbance early on November 7, yet it developed into a tropical depression again at noon, when the system was entering the Gulf of Thailand from the southernmost border of Thailand and Cambodia.[2][18] Late on the same day, JTWC reported that the organisation and vorticity of 30W had got better.[19] Early on November 8, the tropical depression made landfall over the area about 200 km (125 mi) south-southwest of Bangkok, Thailand.[20] Since 06:00Z, JMA stopped monitoring because it moved out of the area of responsibility.[21]
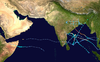
BOB 05
The system arrived at the Andaman Sea by crossing the Malay Peninsula before noon, but then deep convection over the low-level circulation centre dissipated rapidly.[2][22] On November 9, the system slowed down, as well as easterly vertical wind shear had become stronger over the system located southwest of Yangon, Burma, making it remain partially exposed and disorganised.[23] The India Meteorological Department (IMD) started to mention the system as a low-pressure area on the same day, right before it emerged into the Bay of Bengal.[2][24] IMD upgraded it to a well-marked low-pressure area on November 11, yet a microwave imagery showed a broad low-level circulation centre with shallow convection as well as dry air beginning to wrap around the western quadrants.[24][25] On November 13, IMD upgraded the system to a depression and designated it as BOB 05 at 00:00 UTC.[24] As new formative bands developed along the northern and southeastern sectors, JTWC issued a Tropical Cyclone Formation Alert again for the better-organised system at 13:00 UTC.[26] The low-level circulation centre became fully exposed but well-defined on November 14, and deep convection was sheared to the northwest by moderate vertical wind shear which was offsetting easterly diffluent outflow.[27]
On November 15, JTWC upgraded the system to a tropical cyclone and continued designating it 30W, when the low-level circulation centre was tightly wrapped but partially exposed with deep convection sheared to the west. It developed radial outflow, but moderate easterly vertical wind shear kept affecting the tropical cyclone.[28] However, 30W was considered as a tropical cyclone only at 18Z in post-analysis.[2] On November 16, JTWC issued a final warning to 30W, as the intensity became below the warning threshold due to rapidly eroding convection.[29] At 07:30 UTC, Depression BOB 05 made landfall over Tamil Nadu, India, and it weakened into a well-marked low-pressure area overland at 00:00 UTC on the next day, right before emerging into the Arabian Sea.[24] Since that, the remnants no longer had a chance to develop as it continued drafting westward and encountering strong dry air.[30] The remnants became almost stationary and turned west-southwestward on November 20, before finally dissipating near Socotra, Yemen on the next day.[2]
Being a weak tropical depression, Wilma did not cause fatalities in the Philippines, but it still damaged houses and brought flooding. In Bohol, 83 houses and a wooden bridge were damaged, as well as several towns were flooded. The tropical depression also caused flooding in Palawan, leading to the evacuation of 146 families. Two bridges collapsed due to the flooding, and a further two bridges made impassable.[31] When Wilma made landfall, 4,355 passengers were stranded in seaports in Visayas, as well as 352 passengers were stranded in Manila.[10] Only three days after Wilma left the Philippines, Typhoon Haiyan (Yolanda) made landfall over there and became the deadliest Philippine typhoon in modern history.
Vietnam
Total damage in Vietnam reached 34 billion dong (US$1.5 million, 2013 USD).[32]
India
Depression BOB 05 brought a heavy downpour and caused 16 deaths in Tamil Nadu. Two people were drowned by flooding, and one woman was killed by a collapsing wall. Hundreds of trees were uprooted, and many banana plantations were damaged in Nagapattinam following gusty winds. The downpour also brought copious inflows to various reservoirs and lakes in the state that supply drinking water to the people.[33] In Sirkazhi, electric posts were damaged with power supply suspended in most parts of the district, and the roof of a school building flew off due to squally winds. A fish auction hall building near Tharangambadi was also damaged due to strong winds. More than 10,000 fishermen did not venture into the sea due to the very rough sea condition and visible high tides in many places.[34]
^The Joint Typhoon Warning Center (JTWC) designated the system as Tropical Storm 30W in the Northwest Pacific Ocean and Tropical Cyclone 30W in the North Indian Ocean.
References
^"Marine Weather Warning for GMDSS Metarea XI 2013-10-30T18:00:00Z". WIS Portal – GISC Tokyo. Japan Meteorological Agency. Retrieved 28 May 2014.
^ abcdefg"Best track data of Tropical Storm/Tropical Cyclone 30W (Thirty)". Joint Typhoon Warning Center. Retrieved 15 July 2014.
^"Marine Weather Warning for GMDSS Metarea XI 2013-11-01T18:00:00Z". WIS Portal – GISC Tokyo. Japan Meteorological Agency. Retrieved 28 May 2014.
^"Marine Weather Warning for GMDSS Metarea XI 2013-11-02T00:00:00Z". WIS Portal – GISC Tokyo. Japan Meteorological Agency. Retrieved 28 May 2014.
^"Significant Tropical Weather Advisory for the Western and South Pacific Oceans 020600Z-030600Z Nov 2013". Joint Typhoon Warning Center. Archived from the original on 29 May 2014. Retrieved 28 May 2014.
^"Marine Weather Warning for GMDSS Metarea XI 2013-11-03T00:00:00Z". WIS Portal – GISC Tokyo. Japan Meteorological Agency. Retrieved 28 May 2014.
^"Tropical Cyclone Formation Alert at 0530Z on November 3". Joint Typhoon Warning Center. Archived from the original on 22 May 2024. Retrieved 28 May 2014.
^"Prognostic Reasoning for Tropical Depression 30W (Thirty) Warning Nr 01". Joint Typhoon Warning Center. Archived from the original on 22 May 2024. Retrieved 28 May 2014.
^"Tropical Depression "WILMA" Severe Weather Bulletin Number ONE". Philippine Atmospheric, Geophysical and Astronomical Services Administration. Archived from the original on 22 May 2024. Retrieved 28 May 2014.
^ ab"Wilma makes landfall in Surigao Sur". The Philippine Star. Retrieved 28 May 2014.
^"RSMC Tropical Cyclone Advisory at 0600Z on November 4". Japan Meteorological Agency. Archived from the original on 22 May 2024. Retrieved 28 May 2014.
^"Tropical Depression "WILMA" Severe Weather Bulletin Number THREE (FINAL)". Philippine Atmospheric, Geophysical and Astronomical Services Administration. Archived from the original on 22 May 2024. Retrieved 28 May 2014.
^"Prognostic Reasoning for Tropical Depression 30W (Thirty) Warning Nr 06". Joint Typhoon Warning Center. Archived from the original on 22 May 2024. Retrieved 29 May 2014.
^"Prognostic Reasoning for Tropical Storm 30W (Thirty) Warning Nr 10". Joint Typhoon Warning Center. Archived from the original on 22 May 2024. Retrieved 29 May 2014.
^"Prognostic Reasoning for Tropical Depression 30W (Thirty) Warning Nr 11". Joint Typhoon Warning Center. Archived from the original on 22 May 2024. Retrieved 29 May 2014.
^"Tropical Depression 30W (Thirty) Warning Nr 013". Joint Typhoon Warning Center. Archived from the original on 22 May 2024. Retrieved 29 May 2014.
^"Marine Weather Warning for GMDSS Metarea XI 2013-11-06T12:00:00Z". WIS Portal – GISC Tokyo. Japan Meteorological Agency. Retrieved 29 May 2014.
^"Marine Weather Warning for GMDSS Metarea XI 2013-11-07T12:00:00Z". WIS Portal – GISC Tokyo. Japan Meteorological Agency. Retrieved 29 May 2014.
^"Significant Tropical Weather Advisory for the Western and South Pacific Oceans Reissued 072030Z-080600Z Nov 2013". Joint Typhoon Warning Center. Archived from the original on 29 May 2014. Retrieved 29 May 2014.
^"Marine Weather Warning for GMDSS Metarea XI 2013-11-08T00:00:00Z". WIS Portal – GISC Tokyo. Japan Meteorological Agency. Retrieved 29 May 2014.
^"Marine Weather Warning for GMDSS Metarea XI 2013-11-08T06:00:00Z". WIS Portal – GISC Tokyo. Japan Meteorological Agency. Retrieved 29 May 2014.
^"Significant Tropical Weather Advisory for the Indian Ocean 081800Z-091800Z Nov 2013". Joint Typhoon Warning Center. Archived from the original on 29 May 2014. Retrieved 29 May 2014.
^"Significant Tropical Weather Advisory for the Indian Ocean Reissued 090600Z-091800Z Nov 2013". Joint Typhoon Warning Center. Archived from the original on 29 May 2014. Retrieved 29 May 2014.
^ abcd"A Preliminary Report on Depression over Bay of Bengal (13 - 17 November, 2013)" (PDF). India Meteorological Department. December 2013. Retrieved 29 May 2014.
^"Significant Tropical Weather Advisory for the Indian Ocean 111800Z-121800Z Nov 2013". Joint Typhoon Warning Center. Archived from the original on 29 May 2014. Retrieved 29 May 2014.
^"Tropical Cyclone Formation Alert at 1300Z on November 13". Joint Typhoon Warning Center. Archived from the original on 29 May 2014. Retrieved 29 May 2014.
^"Tropical Cyclone Formation Alert Reissued at 1300Z on November 14". Joint Typhoon Warning Center. Archived from the original on 29 May 2014. Retrieved 29 May 2014.
^"Tropical Cyclone 30W (Thirty) Warning Nr 014". Joint Typhoon Warning Center. Archived from the original on 22 May 2024. Retrieved 29 May 2014.
^"Tropical Cyclone 30W (Thirty) Warning Nr 017". Joint Typhoon Warning Center. Archived from the original on 22 May 2024. Retrieved 29 May 2014.
^"Vapor imagery at 1300Z on November 19". U.S. Naval Research Laboratory. Retrieved 29 May 2014.
^Davies, Richard. "Two Tropical Storms to hit the Central Philippines within a week". FloodList. Retrieved 29 May 2014.
^"TỔNG HỢP THIỆT HẠI DO THIÊN TAI NĂM 2013" (PDF) (in Vietnamese). Retrieved 2023-08-21.
^"16 killed in Tamil Nadu downpour". Deccan Herald. 19 November 2013. Retrieved 29 May 2014.
^"Deep depression crosses Tamil Nadu coast, fishermen keep at bay". India Today. Retrieved 29 May 2014.
External links
JTWC Best Track Data of Tropical Storm/Tropical Cyclone 30W (Thirty)
30W.THIRTY from the U.S. Naval Research Laboratory
Preliminary Report of Depression BOB 05 by the India Meteorological Department


 Extratropical cyclone, remnant low, tropical disturbance, or monsoon depression