Timeline of the 2015 Pacific hurricane season
| Timeline of the 2015 Pacific hurricane season | |||||||
|---|---|---|---|---|---|---|---|
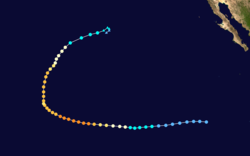
 Season summary map | |||||||
| Season boundaries | |||||||
| First system formed | May 28, 2015 | ||||||
| Last system dissipated | December 31, 2015 (record latest) | ||||||
| Strongest system | |||||||
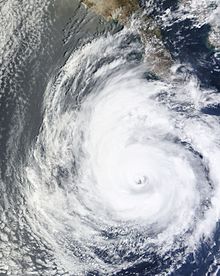
| Name | Patricia (Most intense hurricane in the Western Hemisphere) | ||||||
| Maximum winds | 215 mph (345 km/h) (1-minute sustained) | ||||||
| Lowest pressure | 872 mbar (hPa; 25.75 inHg) | ||||||
| Longest lasting system | |||||||
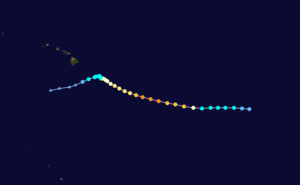
| Name | Jimena | ||||||
| Duration | 14.75 days | ||||||
| |||||||
| Other years 2013, 2014, 2015, 2016, 2017 | |||||||
The 2015 Pacific hurricane season was the second-most active Pacific hurricane season on record,[1] and featured the strongest tropical cyclone ever observed in the Western Hemisphere: Hurricane Patricia. The season officially started on May 15 in the Eastern Pacific—east of 140°W—and on June 1 in the Central Pacific—between the International Date Line and 140°W—and ended on November 30. These dates typically cover the period of each year when most tropical cyclones form in the Northeastern Pacific tropical cyclone basin.[2] The season's first storm, Hurricane Andres, developed on May 28; the season's final storm, Tropical Depression Nine-C, dissipated on December 31, well after the official end of the season.
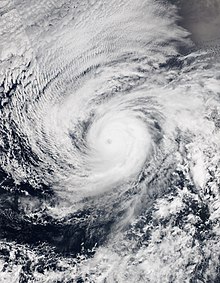
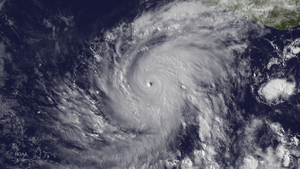
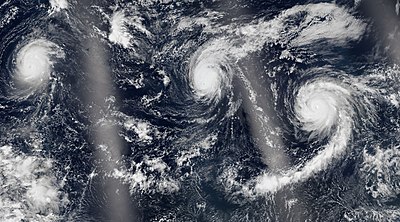
Throughout the season, 31 tropical depressions developed, 26 of which became tropical storms, a record-tying 16 of them reached hurricane strength, and a record-breaking 11 achieved major hurricane intensity.[nb 1] Activity in the Central Pacific shattered records, with 16 tropical cyclones forming in or entering the basin; the previous highest was 11 during the 1992 and 1994 seasons.[4] On August 30, three hurricanes at Category 4 strength—Ignacio, Jimena, and Kilo—existed simultaneously in the Northeastern Pacific, which was a first for the basin.[5] On October 23, Hurricane Patricia became the strongest hurricane ever recorded in the Western Hemisphere, with a minimum atmospheric pressure of 872 mbar (hPa; 25.75 inHg) and maximum sustained winds of 215 mph (345 km/h). Activity in the basin was boosted by the strong 2014–16 El Niño event, which brought anomalously high sea surface temperatures and low vertical wind shear that helped the numerous systems form and intensify.[6][7]
Four time zones are utilized in the basin: Central for storms east of 106.0°W, Mountain from 106.0°W to 114.9°W, Pacific from 115.0°W to 140.0°W,[8] and Hawaii–Aleutian for storms between the International Date Line and 140°W.[9] However, for convenience, all information is listed by Coordinated Universal Time (UTC) first with the respective local time included in parentheses. This timeline includes information that was not operationally released, meaning that data from post-storm reviews by the National Hurricane Center and Central Pacific Hurricane Center are included. This timeline documents tropical cyclone formations, strengthening, weakening, landfalls, extratropical transitions, and dissipations during the season.
Timeline

May
May 15
- The 2015 Pacific hurricane season officially begins.[2]
May 28
- 06:00 UTC (12:00 a.m. MDT) at 10°48′N 109°54′W / 10.8°N 109.9°W / 10.8; -109.9 (Tropical Depression One-E develops) – Tropical Depression One-E develops from an area of disturbed weather about 830 mi (1,335 km)[nb 2] south of the southern tip of the Baja California Peninsula.[10]
- 12:00 UTC (6:00 a.m. MDT) at 11°06′N 111°00′W / 11.1°N 111.0°W / 11.1; -111.0 (Tropical Depression One-E becomes Tropical Storm Andres) – Tropical Depression One-E intensifies into a tropical storm and is named Andres while located 815 mi (1,310 km) south of the southern tip of the Baja California Peninsula.[10]
May 29
- 18:00 UTC (12:00 p.m. MDT) at 12°36′N 114°36′W / 12.6°N 114.6°W / 12.6; -114.6 (Tropical Storm Andres intensifies into a hurricane) – Tropical Storm Andres intensifies to a Category 1 hurricane approximately 485 mi (780 km) southwest of Socorro Island.[10]
May 30
- 12:00 UTC (5:00 a.m. PDT) at 14°06′N 115°42′W / 14.1°N 115.7°W / 14.1; -115.7 (Hurricane Andres reaches Category 2 status) – Hurricane Andres strengthens into a Category 2 hurricane about 445 mi (715 km) southwest of Socorro Island.[10]
May 31
- 00:00 UTC (5:00 p.m. PDT, May 30) at 15°00′N 116°36′W / 15.0°N 116.6°W / 15.0; -116.6 (Hurricane Andres reaches Category 3 status) – Hurricane Andres intensifies to a Category 3 hurricane roughly 450 mi (725 km) southwest of Socorro Island. This marks only the fifth such storm since 1971 to develop during May.[10]
- 12:00 UTC (7:00 a.m. CDT) at 12°00′N 102°12′W / 12.0°N 102.2°W / 12.0; -102.2 (Tropical Depression Two-E develops) – Tropical Depression Two-E develops from an area of disturbed weather approximately 370 mi (595 km) south-southwest of Acapulco, Mexico.[11]
June
June 1
- 00:00 UTC (5:00 p.m. PDT, May 31) at 15°18′N 119°00′W / 15.3°N 119.0°W / 15.3; -119.0 (Hurricane Andres reaches Category 4 status) – Hurricane Andres strengthens into a Category 4 hurricane about 580 mi (935 km) west-southwest of Socorro Island.[10]
- 06:00 UTC (11:00 p.m. PDT, May 31) at 15°24′N 119°30′W / 15.4°N 119.5°W / 15.4; -119.5 (Hurricane Andres reaches its peak intensity) – Hurricane Andres achieves its peak intensity with maximum sustained winds of 145 mph (230 km/h) and a barometric pressure of 937 mbar (hPa; 27.67 inHg) while situated 605 mi (975 km) west-southwest of Socorro Island.[10]
- 12:00 UTC (7:00 a.m. CDT) at 13°18′N 103°30′W / 13.3°N 103.5°W / 13.3; -103.5 (Tropical Depression Two-E becomes Tropical Storm Blanca) – Tropical Depression Two-E intensifies into Tropical Storm Blanca roughly 345 mi (555 km) southwest of Acapulco, Mexico.[11]
June 2
- 00:00 UTC (5:00 p.m. PDT, June 1) at 16°18′N 121°12′W / 16.3°N 121.2°W / 16.3; -121.2 (Hurricane Andres weakens to Category 3 status) – Hurricane Andres weakens to a Category 3 hurricane roughly 695 mi (1,120 km) west-southwest of Socorro Island.[10]
- 06:00 UTC (11:00 p.m. PDT, June 1) at 16°54′N 121°54′W / 16.9°N 121.9°W / 16.9; -121.9 (Hurricane Andres weakens to Category 2 status) – Hurricane Andres weakens to a Category 2 hurricane approximately 730 mi (1,175 km) west-southwest of Socorro Island.[10]
- 12:00 UTC (5:00 a.m. PDT) at 17°24′N 122°42′W / 17.4°N 122.7°W / 17.4; -122.7 (Hurricane Andres weakens to Category 1 status) – Hurricane Andres weakens to a Category 1 hurricane about 775 mi (1,245 km) west of Socorro Island.[10]
- 18:00 UTC (1:00 p.m. CDT) at 12°54′N 104°30′W / 12.9°N 104.5°W / 12.9; -104.5 (Tropical Storm Blanca intensifies into a hurricane) – Tropical Storm Blanca intensifies into a Category 1 hurricane roughly 410 mi (660 km) south-southwest of Zihuatanejo, Mexico.[11]
June 3
- 06:00 UTC (11:00 p.m. PDT, June 2) at 18°54′N 124°42′W / 18.9°N 124.7°W / 18.9; -124.7 (Hurricane Andres weakens to a tropical storm) – Hurricane Andres weakens to a tropical storm about 895 mi (1,440 km) west of Socorro Island.[10]
- 06:00 UTC (1:00 a.m. CDT) at 12°36′N 104°36′W / 12.6°N 104.6°W / 12.6; -104.6 (Hurricane Blanca reaches Category 2 status) – Hurricane Blanca strengthens into a Category 2 hurricane about 430 mi (690 km) southwest of Acapulco, Mexico.[11]
- 12:00 UTC (7:00 a.m. CDT) at 12°24′N 104°36′W / 12.4°N 104.6°W / 12.4; -104.6 (Hurricane Blanca reaches Category 4 status) – Hurricane Blanca rapidly intensifies to Category 4 intensity about 440 mi (710 km) southwest of Acapulco, Mexico. This marks the earliest occurrence of a season's second major hurricane since reliable records began in 1971.[11]
- 18:00 UTC (1:00 p.m. CDT) at 12°18′N 104°36′W / 12.3°N 104.6°W / 12.3; -104.6 (Hurricane Blanca reaches its peak intensity) – Hurricane Blanca achieves its peak intensity with winds of 145 mph (230 km/h) and a barometric pressure of 936 mbar (hPa; 27.64 inHg) while located about 420 mi (675 km) south-southwest of Lázaro Cárdenas, Mexico.[11]
June 4
- 06:00 UTC (1:00 a.m. CDT) at 12°00′N 104°48′W / 12.0°N 104.8°W / 12.0; -104.8 (Hurricane Blanca weakens to Category 3 status) – Tremendous upwelling of cooler waters underneath Hurricane Blanca results in the storm degrading to Category 3 status about 445 mi (715 km) south-southwest of Lázaro Cárdenas, Mexico.[11][12]
- 12:00 UTC (5:00 a.m. PDT) at 20°12′N 124°48′W / 20.2°N 124.8°W / 20.2; -124.8 (Tropical Storm Andres degenerates into a remnant low) – Tropical Storm Andres degenerates to a remnant low roughly 905 mi (1,455 km) west-northwest of Socorro Island.[10]
- 12:00 UTC (7:00 a.m. CDT) at 12°12′N 104°54′W / 12.2°N 104.9°W / 12.2; -104.9 (Hurricane Blanca weakens to Category 2 status) – Hurricane Blanca rapidly weakens to Category 2 intensity about 435 mi (700 km) south-southwest of Lázaro Cárdenas, Mexico.[11]
June 5
- 12:00 UTC (6:00 p.m. MDT) at 14°30′N 106°30′W / 14.5°N 106.5°W / 14.5; -106.5 (Hurricane Blanca weakens to Category 3 status) – Hurricane Blanca further weakens to a Category 1 strength about 345 mi (555 km) southwest of Manzanillo, Mexico.[11]
June 6
- 00:00 UTC (6:00 p.m. MDT, June 5) at 15°42′N 107°54′W / 15.7°N 107.9°W / 15.7; -107.9 (Hurricane Blanca regains Category 2 status) – Hurricane Blanca re-intensifies to Category 2 status about 330 mi (530 km) southwest of Manzanillo, Mexico.[11]
- 06:00 UTC (12:00 a.m. MDT) at 16°24′N 108°30′W / 16.4°N 108.5°W / 16.4; -108.5 (Hurricane Blanca regains Category 3 status) – Hurricane Blanca regains Category 3 intensity about 365 mi (585 km) southwest of Puerto Vallarta, Mexico.[11]
- 12:00 UTC (6:00 a.m. MDT) at 17°06′N 109°06′W / 17.1°N 109.1°W / 17.1; -109.1 (Hurricane Blanca regains to Category 4 status) – Hurricane Blanca reaches its secondary peak as a Category 4 hurricane with winds of 130 mph (215 km/h) about 355 mi (570 km) southwest of Puerto Vallarta, Mexico.[11]
- 18:00 UTC (12:00 p.m. MDT) at 17°48′N 109°42′W / 17.8°N 109.7°W / 17.8; -109.7 (Hurricane Blanca weakens to Category 3 status) – Hurricane Blanca weakens back to Category 3 status about 350 mi (565 km) southwest of Puerto Vallarta, Mexico.[11]
June 7
- Around 03:30 UTC (9:30 p.m. MDT, June 6) – Hurricane Blanca makes its closest approach to Socorro Island, passing roughly 30 mi (50 km) to the northeast. An automated weather station there records sustained winds of 74 mph (119 km/h), with a peak gust of 101 mph (163 km/h), before it ceases reporting.[11]
- 06:00 UTC (12:00 a.m. MDT) at 19°24′N 110°30′W / 19.4°N 110.5°W / 19.4; -110.5 (Hurricane Blanca weakens to Category 2 status) – Hurricane Blanca weakens to a Category 2 hurricane again about 245 mi (395 km) south-southwest of Cabo San Lucas, Mexico.[11]
- 18:00 UTC (12:00 p.m. MDT) at 20°48′N 110°54′W / 20.8°N 110.9°W / 20.8; -110.9 (Hurricane Blanca weakens to a tropical storm) – Hurricane Blanca degrades to a tropical storm about 160 mi (255 km) south-southwest of Cabo San Lucas, Mexico.[11]
June 8

- 10:00 UTC (4:00 a.m. MDT) at 24°18′N 111°42′W / 24.3°N 111.7°W / 24.3; -111.7 (Tropical Storm Blanca makes landfall over Isla Santa Margarita, Mexico) – Tropical Storm Blanca makes landfall over Isla Santa Margarita, Mexico, with winds of 50 mph (85 km/h). This marks the earliest instance of a tropical cyclone making landfall along the Baja California Peninsula since reliable records began in 1971,[11] and occurred a month earlier than the previous record.[12]
- 11:15 UTC (5:15 a.m. MDT) at 24°30′N 111°48′W / 24.5°N 111.8°W / 24.5; -111.8 (Tropical Storm Blanca makes landfall near Puerto Argudin, Mexico) – Tropical Storm Blanca traverses Magdalena Bay and makes a second landfall along the Baja California Peninsula, this time near Puerto Argudin with winds of 45 mph (75 km/h).[11]
- 20:00 UTC (2:00 p.m. MDT) at 26°36′N 113°00′W / 26.6°N 113.0°W / 26.6; -113.0 (Tropical Depression Blanca makes landfall near El Patrocinio, Mexico) – Tropical Storm Blanca briefly emerges back over the Pacific Ocean, weakening to a tropical depression in the process. It subsequently makes its third and final landfall about 15 mi (25 km) south-southwest of El Patrocinio, Mexico, with winds of 35 mph (55 km/h).[11]
June 9
- 06:00 UTC (12:00 a.m. MDT) at 28°30′N 114°00′W / 28.5°N 114.0°W / 28.5; -114.0 (Tropical Depression Blanca degenerates into a remnant low) – Tropical Depression Blanca degenerates to a non-convective remnant low about 135 mi (215 km) northwest of Santa Rosalía, Mexico.[11]
June 10
- 18:00 UTC (1:00 p.m. CDT) at 12°00′N 98°30′W / 12.0°N 98.5°W / 12.0; -98.5 (Tropical Depression Three-E develops) – Tropical Depression Three-E develops from a large area of low pressure approximately 290 mi (465 km) south-southwest of Puerto Escondido, Mexico.[13]
June 11
- 12:00 UTC (7:00 a.m. CDT) at 13°42′N 100°06′W / 13.7°N 100.1°W / 13.7; -100.1 (Tropical Depression Three-E becomes Tropical Storm Carlos) – Tropical Depression Three-E intensifies into Tropical Storm Carlos about 230 mi (370 km) south of Acapulco, Mexico.[13]
June 13
- 12:00 UTC (7:00 a.m. CDT) at 15°00′N 99°54′W / 15.0°N 99.9°W / 15.0; -99.9 (Tropical Storm Carlos intensifies into a hurricane) – Tropical Storm Carlos intensifies into a Category 1 hurricane about 145 mi (235 km) south of Acapulco, Mexico.[13]
- 18:00 UTC (1:00 p.m. CDT) at 15°06′N 99°54′W / 15.1°N 99.9°W / 15.1; -99.9 (Hurricane Carlos attains its lowest pressure) – Hurricane Carlos attains its lowest barometric pressure of 978 mbar (hPa; 28.88 inHg) approximately 120 mi (195 km) south of Acapulco, Mexico.[13]
June 15
- 00:00 UTC (7:00 p.m. CDT, June 14) at 16°36′N 101°12′W / 16.6°N 101.2°W / 16.6; -101.2 (Hurricane Carlos weakens to a tropical storm) – Hurricane Carlos degrades into a tropical storm, possibly due to upwelling of cooler waters from its slow motion, while situated 75 mi (120 km) west-southwest of Acapulco, Mexico.[13]
- 18:00 UTC (1:00 p.m. CDT) at 16°54′N 102°48′W / 16.9°N 102.8°W / 16.9; -102.8 (Tropical Storm Carlos regains hurricane status) – Tropical Storm Carlos regains hurricane status about 85 mi (135 km) southwest of Lázaro Cárdenas, Mexico.[13]
June 16
- 18:00 UTC (1:00 p.m. CDT) at 17°42′N 104°18′W / 17.7°N 104.3°W / 17.7; -104.3 (Hurricane Carlos attains its maximum winds) – The unusually small Hurricane Carlos, with tropical-storm-force winds extending just 45 mi (72 km) from its center, attains its peak winds of 90 mph (150 km/h) roughly 90 mi (145 km) south of Manzanillo, Mexico.[13]
June 17
- 06:00 UTC (1:00 a.m. CDT) at 18°48′N 104°42′W / 18.8°N 104.7°W / 18.8; -104.7 (Hurricane Carlos weakens to a tropical storm) – Hurricane Carlos quickly degrades to a tropical storm about 30 mi (50 km) southwest of Manzanillo, Mexico.[13]
- 09:00 UTC (4:00 a.m. CDT) at 19°18′N 104°54′W / 19.3°N 104.9°W / 19.3; -104.9 (Tropical Storm Carlos makes landfall near Tenacatita, Mexico) – Tropical Storm Carlos makes landfall near Tenacatita, Mexico, with winds of 50 mph (85 km/h).[13]
- 18:00 UTC (12:00 p.m. MDT) at 20°24′N 105°42′W / 20.4°N 105.7°W / 20.4; -105.7 (Tropical Storm Carlos degenerates into a remnant low) – Tropical Storm Carlos degenerates into a remnant low, with winds falling below gale-force, approximately 35 mi (55 km) southwest of Puerto Vallarta, Mexico.[13]
July
July 8

- 00:00 UTC (5:00 p.m. PDT, July 7) at 15°18′N 139°30′W / 15.3°N 139.5°W / 15.3; -139.5 (Tropical Depression Four-E develops) – Tropical Depression Four-E forms about 1,025 mi (1,650 km) east-southeast of Hilo, Hawaii, quickly crossing west of 140°W and entering the Central Pacific basin.[14]
- 12:00 UTC (2:00 a.m. HST) at 16°36′N 142°00′W / 16.6°N 142.0°W / 16.6; -142.0 (Tropical Depression Four-E becomes Tropical Storm Ela) – Tropical Depression Four-E intensifies into Tropical Storm Ela about 885 mi (1,425 km) east-southeast of Hilo, Hawaii.[14]
- 18:00 UTC (8:00 a.m. HST) at 17°12′N 143°24′W / 17.2°N 143.4°W / 17.2; -143.4 (Tropical Storm Ela peaks) – Tropical Storm Ela reaches its peak strength with winds of 40 mph (65 km/h) and a pressure of 1002 mbar (hPa; 29.59 inHg), while located approximately 785 mi (1,265 km) east-southeast of Hilo, Hawaii.[14]
July 10
- 00:00 UTC (2:00 p.m. HST, July 9) at 20°54′N 147°00′W / 20.9°N 147.0°W / 20.9; -147.0 (Tropical Storm Ela weakens to a tropical depression) – Tropical Storm Ela weakens to a tropical depression about 530 mi (855 km) east of Hilo, Hawaii.[14]
- 06:00 UTC (8:00 p.m. HST, July 9) at 11°30′N 169°54′W / 11.5°N 169.9°W / 11.5; -169.9 (Tropical Depression One-C develops) – Tropical Depression One-C develops from an area of low pressure about 1,025 mi (1,650 km) southwest of Honolulu, Hawaii.[15]
- 06:00 UTC (8:00 p.m. HST, July 9) at 10°54′N 154°24′W / 10.9°N 154.4°W / 10.9; -154.4 (Tropical Depression Two-C develops) – Tropical Depression Two-C develops from an area of low pressure about 750 mi (1,205 km) southeast of Honolulu, Hawaii.[16]
- 12:00 UTC (2:00 a.m. HST) at 21°42′N 148°30′W / 21.7°N 148.5°W / 21.7; -148.5 (Tropical Depression Ela degenerates into a post-tropical low) – Tropical Depression Ela degenerates into a post-tropical low about 445 mi (715 km) east-northeast of Hilo, Hawaii.[14]
July 11
- 00:00 UTC (2:00 p.m. HST, July 10) at 11°24′N 172°42′W / 11.4°N 172.7°W / 11.4; -172.7 (Tropical Depression One-C becomes Tropical Storm Halola) – Tropical Depression One-C strengthens into Tropical Storm Halola about 1,200 mi (1,930 km) southwest of Honolulu, Hawaii.[15]
- 12:00 UTC (7:00 a.m. CDT) at 11°54′N 98°24′W / 11.9°N 98.4°W / 11.9; -98.4 (Tropical Depression Five-E develops) – Tropical Depression Five-E develops from an area of low pressure about 345 mi (555 km) south-southeast of Acapulco, Mexico.[17]
- 18:00 UTC (8:00 a.m. HST) at 14°24′N 157°36′W / 14.4°N 157.6°W / 14.4; -157.6 (Tropical Depression Two-C becomes Tropical Storm Iune) – Tropical Depression Two-C intensifies into Tropical Storm Iune about 475 mi (765 km) south of Honolulu, Hawaii. Iune simultaneously reaches its peak strength with winds of 40 mph (65 km/h) and a pressure of 1004 mbar (hPa; 29.65 inHg).[16]
- 18:00 UTC (1:00 p.m. CDT) at 12°12′N 99°24′W / 12.2°N 99.4°W / 12.2; -99.4 (Tropical Depression Five-E becomes Tropical Storm Dolores) – Tropical Depression Five-E intensifies into Tropical Storm Dolores about 325 mi (525 km) south of Acapulco, Mexico.[17]
July 12
- 06:00 UTC (8:00 p.m. HST, July 11) at 11°24′N 177°42′W / 11.4°N 177.7°W / 11.4; -177.7 (Tropical Storm Halola attains its peak strength while within the Central Pacific basin) – Tropical Storm Halola attains winds of 60 mph (95 km/h) and a pressure of 999 mbar (hPa; 29.50 inHg), its maximum strength while within the Central Pacific basin.[15]
- 12:00 UTC (5:00 a.m. PDT) at 13°06′N 125°00′W / 13.1°N 125.0°W / 13.1; -125.0 (Tropical Depression Six-E develops) – Tropical Depression Six-E develops from a broad low approximately 1,195 mi (1,920 km) west-southwest of Cabo San Lucas, Mexico.[18]
- 18:00 UTC (8:00 a.m. HST) at 14°48′N 160°36′W / 14.8°N 160.6°W / 14.8; -160.6 (Tropical Storm Iune weakens to a tropical depression) – Tropical Storm Iune weakens to a tropical depression about 485 mi (780 km) south-southwest of Honolulu, Hawaii.[16]
July 13
- 00:00 UTC (2:00 p.m. HST, July 12) – Tropical Storm Halola crosses the International Date Line (180°), entering the Western Pacific basin, and the Japan Meteorological Agency assumes monitoring responsibilities. Additional advisories are issued by the Joint Typhoon Warning Center and the National Weather Service office in Guam.[15]
- 06:00 UTC (11:00 p.m. PDT) at 14°42′N 126°06′W / 14.7°N 126.1°W / 14.7; -126.1 (Tropical Depression Six-E becomes Tropical Storm Enrique) – Tropical Depression Six-E strengthens into Tropical Storm Enrique roughly 1,200 mi (1,930 km) southwest of Cabo San Lucas, Mexico.[18]
- 12:00 UTC (6:00 a.m. MDT) at 16°48′N 105°18′W / 16.8°N 105.3°W / 16.8; -105.3 (Tropical Storm Dolores reaches hurricane strength) – Tropical Storm Dolores intensifies into a Category 1 hurricane about 170 mi (275 km) southwest of Manzanillo, Mexico.[17]
- 12:00 UTC at 14°24′N 163°24′W / 14.4°N 163.4°W / 14.4; -163.4 (Tropical Depression Iune degenerates into a post-tropical low) – Tropical Depression Iune degenerates to a post-tropical low about 600 mi (965 km) southwest of Honolulu, Hawaii.[16]
July 14
- 18:00 UTC (11:00 a.m. PDT) at 17°54′N 130°06′W / 17.9°N 130.1°W / 17.9; -130.1 (Tropical Storm Enrique reaches its peak intensity) – Tropical Storm Enrique attains its peak intensity with winds of 50 mph (85 km/h) and a pressure of 1000 mbar (hPa; 29.53 inHg) while situated 1,355 mi (2,180 km) west-southwest of Cabo San Lucas, Mexico.[18]
- July 15
- 00:00 UTC (6:00 p.m. MDT, July 14) at 18°00′N 108°54′W / 18.0°N 108.9°W / 18.0; -108.9 (Hurricane Dolores reaches Category 2 status) – Hurricane Dolores strengthens to Category 2 intensity about 345 mi (555 km) south of Cabo San Lucas, Mexico.[17]
- 06:00 UTC (12:00 a.m. MDT) at 18°06′N 109°24′W / 18.1°N 109.4°W / 18.1; -109.4 (Hurricane Dolores reaches Category 4 status) – Hurricane Dolores rapidly intensifies into a Category 4 hurricane approximately 110 mi (175 km) southeast of Socorro Island. It simultaneously achieves its peak strength with winds of 130 mph (215 km/h) and a pressure of 946 mbar (hPa; 27.94 inHg).[17]
- 12:00 UTC (6:00 a.m. MDT) at 18°12′N 109°54′W / 18.2°N 109.9°W / 18.2; -109.9 (Hurricane Dolores weakens to Category 3 status) – Hurricane Dolores weakens to Category 3 status about 75 mi (120 km) southeast of Socorro Island.[17]
July 16
- 00:00 UTC (6:00 p.m. MDT, July 15) at 18°54′N 110°42′W / 18.9°N 110.7°W / 18.9; -110.7 (Hurricane Dolores weakens to Category 2 status) – Hurricane Dolores weakens to Category 2 status as it makes its closest approach to Socorro Island, passing roughly 20 to 25 mi (32 to 40 km) to the northeast. An automated weather station records sustained winds of 79 mph (127 km/h) and a peak gust of 115 mph (185 km/h).[17]
July 17
- 00:00 UTC (6:00 p.m. MDT, July 16) at 20°36′N 112°54′W / 20.6°N 112.9°W / 20.6; -112.9 (Hurricane Dolores weakens to Category 1 status) – Hurricane Dolores weakens to Category 1 intensity about 250 mi (400 km) southwest of Cabo San Lucas, Mexico.[17]
- 12:00 UTC (5:00 a.m. PDT) at 21°12′N 114°36′W / 21.2°N 114.6°W / 21.2; -114.6 (Hurricane Dolores weakens to a tropical storm) – Hurricane Dolores weakens into a tropical storm about 325 mi (525 km) west-southwest of Cabo San Lucas, Mexico.[17]
- 12:00 UTC (5:00 a.m. PDT) at 20°30′N 136°48′W / 20.5°N 136.8°W / 20.5; -136.8 (Tropical Storm Enrique weakens to a tropical depression) – Tropical Storm Enrique weakens to a tropical depression roughly 1,190 mi (1,915 km) east-southeast of Hilo, Hawaii.[18]
July 18
- 12:00 UTC (5:00 a.m. PDT) at 20°00′N 137°24′W / 20.0°N 137.4°W / 20.0; -137.4 (Tropical Depression Enrique degenerates into a remnant low) – Tropical Depression Enrique degenerates into a remnant low about 1,150 mi (1,850 km) east-southeast of Hilo, Hawaii.[18]
- 18:00 UTC (11:00 a.m. PDT) at 23°48′N 118°12′W / 23.8°N 118.2°W / 23.8; -118.2 (Tropical Storm Dolores degenerates into a remnant low) – Tropical Storm Dolores degenerates into a remnant low approximately 420 mi (675 km) west of Ciudad Constitución, Mexico.[17]
July 23
- 06:00 UTC (12:00 a.m. MDT) at 17°48′N 113°48′W / 17.8°N 113.8°W / 17.8; -113.8 (Tropical Depression Seven-E develops) – Tropical Depression Seven-E develops from an elongated area of low pressure about 430 mi (690 km) southwest of Cabo San Lucas, Mexico.[19]
- 12:00 UTC (6:00 a.m. MDT) at 18°36′N 114°30′W / 18.6°N 114.5°W / 18.6; -114.5 (Tropical Depression Seven-E becomes Tropical Storm Felicia) – Tropical Depression Seven-E intensifies into Tropical Storm Felicia roughly 420 mi (675 km) southwest of Cabo San Lucas, Mexico. The system simultaneously attains its peak strength with winds of 40 mph (65 km/h) and a pressure of 1004 mbar (hPa; 29.65 inHg).[19]
July 24
- 00:00 UTC (5:00 p.m. PDT, July 23) at 20°06′N 116°06′W / 20.1°N 116.1°W / 20.1; -116.1 (Tropical Storm Felicia weakens to a tropical depression) – Tropical Storm Felicia weakens into a tropical depression about 445 mi (715 km) southwest of Cabo San Lucas, Mexico.[19]
- 18:00 UTC (11:00 a.m. PDT) at 22°18′N 118°30′W / 22.3°N 118.5°W / 22.3; -118.5 (Tropical Depression Felicia degenerates into a remnant low) – Tropical Depression Felicia degenerates into a remnant low about 550 mi (885 km) west-southwest of Cabo San Lucas, Mexico.[19]
July 27
- 18:00 UTC (11:00 a.m. PDT) at 15°24′N 125°12′W / 15.4°N 125.2°W / 15.4; -125.2 (Tropical Depression Eight-E develops) – Tropical Depression Eight-E develops from an area of low pressure about 1,115 mi (1,795 km) west-southwest of Cabo San Lucas, Mexico. It simultaneously attains its peak strength with winds of 35 mph (55 km/h) and a pressure of 1006 mbar (hPa; 29.71 inHg).[20]
July 29
- 18:00 UTC (11:00 a.m. PDT) at 7°48′N 123°24′W / 7.8°N 123.4°W / 7.8; -123.4 (Tropical Depression Nine-E develops) – Tropical Depression Nine-E develops from an area of low pressure about 1,440 mi (2,315 km) southwest of the southern tip of the Baja California Peninsula.[21]
July 30
- 00:00 UTC (5:00 p.m. PDT, July 29) at 8°00′N 124°42′W / 8.0°N 124.7°W / 8.0; -124.7 (Tropical Depression Nine-E becomes Tropical Storm Guillermo) – Tropical Depression Nine-E intensifies into Tropical Storm Guillermo about 1,420 mi (2,285 km) southwest of Cabo San Lucas, Mexico.[21]
- 00:00 UTC (5:00 p.m. PDT, July 30) at 16°36′N 136°24′W / 16.6°N 136.4°W / 16.6; -136.4 (Tropical Depression Eight-E degenerates into a remnant low) – Tropical Depression Eight-E degenerates to a remnant area of low pressure about 1,225 mi (1,970 km) east of the Big Island of Hawaii.[20]
July 31
- 06:00 UTC (11:00 p.m. PDT, July 30) at 11°12′N 130°00′W / 11.2°N 130.0°W / 11.2; -130.0 (Tropical Storm Guillermo reaches hurricane strength) – Tropical Storm Guillermo strengthens into a Category 1 hurricane about 1,770 mi (2,850 km) southeast of Hilo, Hawaii.[21]
- 12:00 UTC (5:00 a.m. PDT) at 12°06′N 131°54′W / 12.1°N 131.9°W / 12.1; -131.9 (Hurricane Guillermo reaches Category 2 status) – Hurricane Guillermo attains Category 2 intensity about 1,625 mi (2,615 km) southeast of Hilo, Hawaii.[21]
- 18:00 UTC (11:00 a.m. PDT) at 12°30′N 133°54′W / 12.5°N 133.9°W / 12.5; -133.9 (Hurricane Guillermo reaches its peak intensity) – Hurricane Guillermo reaches its peak strength with winds of 110 mph (175 km/h) and a pressure of 967 mbar (hPa; 28.56 inHg) while situated 1,490 mi (2,400 km) southeast of Hilo, Hawaii.[21]
August
August 2
- 00:00 UTC (2:00 p.m. HST, August 1) – Hurricane Guillermo crosses west of 140°W and enters the Central Pacific basin.[21]
- 18:00 UTC (8:00 a.m. HST) at 14°54′N 143°42′W / 14.9°N 143.7°W / 14.9; -143.7 (Hurricane Guillermo weakens to Category 1 intensity) – Hurricane Guillermo weakens to Category 1 intensity about 820 mi (1,320 km) southeast of Hilo, Hawaii.[21]
August 3
- 12:00 UTC (2:00 a.m. HST) at 16°36′N 145°42′W / 16.6°N 145.7°W / 16.6; -145.7 (Hurricane Guillermo weakens to a tropical storm) – Hurricane Guillermo weakens to a tropical storm approximately 655 mi (1,050 km) east-southeast of Hilo, Hawaii.[21]
August 6
- 00:00 UTC (5:00 p.m. PDT, August 5) at 12°24′N 129°12′W / 12.4°N 129.2°W / 12.4; -129.2 (Tropical Depression Ten-E develops) – Tropical Depression Ten-E develops from a tropical wave about 1,495 mi (2,405 km) west-southwest of Cabo San Lucas, Mexico.[22]
- 12:00 UTC (5:00 a.m. PDT) at 12°36′N 131°30′W / 12.6°N 131.5°W / 12.6; -131.5 (Tropical Depression Ten-E becomes Tropical Storm Hilda) – Tropical Depression Ten-E strengthens into Tropical Storm Hilda roughly 1,585 mi (2,550 km) west-southwest of Cabo San Lucas, Mexico.[22]
August 7
- 00:00 UTC (2:00 p.m. HST, August 6) at 21°36′N 155°24′W / 21.6°N 155.4°W / 21.6; -155.4 (Tropical Storm Guillermo weakens to a tropical depression) – Tropical Storm Guillermo weakens to a tropical depression roughly 130 mi (210 km) north of Hilo, Hawaii.[21]
- 12:00 UTC (2:00 a.m. HST) at 22°30′N 158°06′W / 22.5°N 158.1°W / 22.5; -158.1 (Tropical Depression Guillermo dissipates) – Tropical Depression Guillermo degenerates into a remnant low about 85 mi (135 km) north-northwest of Honolulu, Hawaii.[21]
- 18:00 UTC (11:00 a.m. PDT) at 12°36′N 137°36′W / 12.6°N 137.6°W / 12.6; -137.6 (Tropical Storm Hilda becomes a hurricane) – Tropical Storm Hilda strengthens to a Category 1 hurricane approximately 1,260 mi (2,025 km) east-southeast of Hilo, Hawaii.[22]
August 8
- 00:00 UTC (5:00 p.m. PDT, August 6) at 12°48′N 139°00′W / 12.8°N 139.0°W / 12.8; -139.0 (Hurricane Hilda rapidly reaches Category 3 status) – Hurricane Hilda rapidly intensifies to Category 3 strength about 1,170 mi (1,880 km) east-southeast of Hilo, Hawaii.[22]
- 06:00 UTC (8:00 p.m. HST, August 6) – Hurricane Hilda crosses west of 140°W and enters the Central Pacific basin.[22]
- 18:00 UTC (8:00 a.m. HST) at 13°36′N 142°48′W / 13.6°N 142.8°W / 13.6; -142.8 (Hurricane Hilda becomes a Category 4 hurricane and reaches peak intensity) – Hurricane Hilda strengthens to Category 4 intensity about 915 mi (1,475 km) east-southeast of Hilo, Hawaii. It simultaneously reaches its peak strength with winds of 145 mph (230 km/h) and a pressure of 937 mbar (hPa; 27.67 inHg).[22]
August 9
- 12:00 UTC (2:00 a.m. HST) at 14°30′N 146°12′W / 14.5°N 146.2°W / 14.5; -146.2 (Hurricane Hilda weakens to Category 3 intensity) – Hurricane Hilda weakens to Category 3 status roughly 690 mi (1,110 km) east-southeast of Hilo, Hawaii.[22]
- 18:00 UTC (8:00 a.m. HST) at 14°48′N 147°06′W / 14.8°N 147.1°W / 14.8; -147.1 (Hurricane Hilda weakens to Category 2 intensity) – Hurricane Hilda weakens to Category 2 intensity about 625 mi (1,010 km) southeast of Hilo, Hawaii.[22]
August 10
- 18:00 UTC (8:00 a.m. HST) at 16°12′N 150°00′W / 16.2°N 150.0°W / 16.2; -150.0 (Hurricane Hilda weakens to Category 1 intensity) – Hurricane Hilda weakens to Category 1 intensity about 415 mi (670 km) southeast of Hilo, Hawaii.[22]
August 12
- 00:00 UTC (2:00 p.m. HST, August 11) at 17°06′N 151°30′W / 17.1°N 151.5°W / 17.1; -151.5 (Hurricane Hilda weakens to a tropical storm) – Hurricane Hilda weakens to a tropical storm approximately 295 mi (475 km) southeast of Hilo, Hawaii.[22]
August 13
- 18:00 UTC (8:00 a.m. HST) at 16°30′N 154°12′W / 16.5°N 154.2°W / 16.5; -154.2 (Tropical Storm Hilda weakens to a tropical depression) – Tropical Storm Hilda weakens to a tropical depression roughly 230 mi (370 km) south-southeast of Hilo, Hawaii.[22]
August 14
- 00:00 UTC (2:00 p.m. HST, August 13) at 16°00′N 155°18′W / 16.0°N 155.3°W / 16.0; -155.3 (Tropical Depression Hilda dissipates) – Tropical Depression Hilda degenerates into a remnant low about 255 mi (410 km) south of Hilo, Hawaii.[22]
August 16
- 00:00 UTC (6:00 p.m. MDT, August 15) at 16°30′N 112°54′W / 16.5°N 112.9°W / 16.5; -112.9 (Tropical Depression Eleven-E forms) – Tropical Depression Eleven-E develops from an area of low pressure about 485 mi (780 km) south-southwest of Cabo San Lucas, Mexico. Simultaneously, the depression attains peak winds of 35 mph (55 km/h) and a minimum pressure of 1003 mbar (hPa; 29.62 inHg).[23]
August 18
- 00:00 UTC (6:00 p.m. MDT, August 17) at 23°30′N 123°24′W / 23.5°N 123.4°W / 23.5; -123.4 (Tropical Depression Eleven-E dissipates) – Tropical Depression Eleven-E degenerates into a remnant low about 865 mi (1,390 km) west of Cabo San Lucas, Mexico.[23]
August 21
- 00:00 UTC (2:00 p.m. HST, August 20) at 14°48′N 177°30′W / 14.8°N 177.5°W / 14.8; -177.5 (Tropical Depression Four-C develops) – Tropical Depression Four-C develops about 545 mi (875 km) west-southwest of Johnston Island.[24]
- 18:00 UTC (8:00 a.m. HST) at 16°06′N 177°12′W / 16.1°N 177.2°W / 16.1; -177.2 (Tropical Depression Four-C becomes Tropical Storm Loke) – Tropical Depression Four-C intensifies to Tropical Storm Loke roughly 510 mi (820 km) west of Johnston Island.[24]
August 22
- 06:00 UTC (8:00 p.m. HST, August 21) at 13°12′N 155°48′W / 13.2°N 155.8°W / 13.2; -155.8 (Tropical Depression Kilo forms) – Tropical Depression Kilo forms from a low-pressure area about 450 mi (725 km) south of Hilo, Hawaii.[5]
- 12:00 UTC (2:00 a.m. HST) at 17°12′N 177°54′W / 17.2°N 177.9°W / 17.2; -177.9 (Tropical Storm Loke weakens) – Tropical Storm Loke weakens to a tropical depression about 555 mi (895 km) west of Johnston Island.[24]
August 23
- 00:00 UTC (2:00 p.m. HST, August 22) at 18°24′N 179°00′W / 18.4°N 179.0°W / 18.4; -179.0 (Tropical Depression Loke regains tropical storm status) – Tropical Depression Loke restrengthens into a tropical storm roughly 635 mi (1,020 km) west of Johnston Island.[24]
August 24
- 18:00 UTC (8:00 p.m. HST) at 25°18′N 176°42′W / 25.3°N 176.7°W / 25.3; -176.7 (Tropical Storm Loke strengthens into a hurricane) – Tropical Storm Loke intensifies into a hurricane, approximately 205 mi (330 km) south-southeast of Midway Atoll, as it moves through the Papahānaumokuākea Marine National Monument.[24]
August 25

- 00:00 UTC (5:00 p.m. PDT, August 24) at 13°06′N 131°06′W / 13.1°N 131.1°W / 13.1; -131.1 (Tropical Depression Twelve-E forms) – Tropical Depression Twelve-E forms from a tropical disturbance 1,450 mi (2,380 km) west-southwest of the southern tip of the Baja California Peninsula.[25]
- 12:00 UTC (2:00 a.m. HST) at 28°48′N 173°06′W / 28.8°N 173.1°W / 28.8; -173.1 (Hurricane Loke reaches its peak intensity) – Hurricane Loke attains its peak intensity with winds of 75 mph (120 km/h) and a pressure of 985 mbar (hPa; 29.09 inHg) roughly 260 mi (420 km) east of Midway Atoll.[24]
- 18:00 UTC (8:00 a.m. HST) at 30°06′N 173°00′W / 30.1°N 173.0°W / 30.1; -173.0 (Hurricane Loke weakens to a tropical storm) – Hurricane Loke weakens to a tropical storm about 295 mi (475 km) east-northeast of Midway Atoll.[24]
- 18:00 UTC (11:00 a.m. PDT) at 12°48′N 132°48′W / 12.8°N 132.8°W / 12.8; -132.8 (Tropical Depression Twelve-E becomes Tropical Storm Ignacio) – Tropical Depression Twelve-E strengthens into Tropical Storm Ignacio approximately 1,655 mi (2,660 km) west-southwest of the southern tip of the Baja California Peninsula.[25]
August 26
- 12:00 UTC (6:00 a.m. MDT) at 10°24′N 110°54′W / 10.4°N 110.9°W / 10.4; -110.9 (Tropical Depression Thirteen-E forms) – Tropical Depression Thirteen-E forms from a large low-pressure area roughly 735 mi (1,185 km) southwest of Manzanillo, Mexico.[26]
- 18:00 UTC (8:00 a.m. HST) at 18°18′N 167°42′W / 18.3°N 167.7°W / 18.3; -167.7 (Tropical Depression Kilo becomes a tropical storm) – Tropical Depression Kilo strengthens into a tropical storm around 160 mi (255 km) northeast of Johnston Island.[5]
- 18:00 UTC (8:00 p.m. HST) at 36°36′N 179°12′E / 36.6°N 179.2°E / 36.6; 179.2 (Tropical Storm Loke dissipates) – Last recorded point of Tropical Storm Loke as a tropical cyclone about 590 mi (950 km) north of Midway Atoll. Within the next six hours, Loke crosses the International Date Line and is absorbed by the extratropical cyclone that was formerly Typhoon Atsani.[24]
August 27
- 00:00 UTC (5:00 p.m. PDT, August 26) at 12°00′N 136°54′W / 12.0°N 136.9°W / 12.0; -136.9 (Tropical Storm Ignacio becomes a hurricane) – Tropical Storm Ignacio intensifies into a Category 1 hurricane around 1,925 mi (3,095 km) west-southwest of the southern tip of the Baja California Peninsula.[25]
- 06:00 UTC (11:00 p.m. PDT, August 26) at 12°12′N 115°42′W / 12.2°N 115.7°W / 12.2; -115.7 (Tropical Depression Thirteen-E becomes Tropical Storm Jimena) – Tropical Depression Thirteen-E develops into Tropical Storm Jimena about 895 mi (1,435 km) west-southwest of Manzanillo, Mexico.[26]
- 18:00 UTC (8:00 a.m. HST) at 12°54′N 140°12′W / 12.9°N 140.2°W / 12.9; -140.2 (Hurricane Ignacio crosses 140°W) – Hurricane Ignacio enters the Central Pacific basin as a Category 1 hurricane about 1,095 mi (1,760 km) east-southeast of Hilo, Hawaii.[25]
August 28
- 06:00 UTC (11:00 p.m. PDT, August 27) at 12°12′N 120°30′W / 12.2°N 120.5°W / 12.2; -120.5 (Tropical Storm Jimena intensifies into a hurricane) – Tropical Storm Jimena intensifies into a Category 1 hurricane approximately 1,175 mi (1,890 km) west-southwest of Manzanillo, Mexico.[26]
- 18:00 UTC (11:00 a.m. PDT) at 12°18′N 122°36′W / 12.3°N 122.6°W / 12.3; -122.6 (Hurricane Jimena reaches Category 2 strength) – Hurricane Jimena rapidly intensifies into a Category 2 hurricane roughly 1,110 mi (1,785 km) southwest of the southern tip of the Baja California Peninsula.[26]
August 29
- 00:00 UTC (5:00 p.m. PDT, August 28) at 12°18′N 123°36′W / 12.3°N 123.6°W / 12.3; -123.6 (Hurricane Jimena rapidly reaches Category 4 status) – Hurricane Jimena explosively deepens into a Category 4 hurricane roughly 1,160 mi (1,865 km) southwest of the southern tip of the Baja California Peninsula.[26]
- 06:00 UTC (8:00 p.m. HST, August 28) at 17°42′N 173°00′W / 17.7°N 173.0°W / 17.7; -173.0 (Tropical Storm Kilo reaches hurricane status) – Tropical Storm Kilo strengthens into a Category 1 hurricane about 240 mi (385 km) west-northwest of Johnston Island.[5]
- 06:00 UTC (11:00 p.m. PDT, August 28) at 12°12′N 124°24′W / 12.2°N 124.4°W / 12.2; -124.4 (Hurricane Jimena hits peak intensity) – Hurricane Jimena reaches peak intensity as a high-end Category 4 hurricane, possessing winds of 155 mph (250 km/h) and a minimum pressure of 932 mbar (hPa; 27.52 inHg), around 1,210 mi (1,945 km) southwest of the southern tip of the Baja California Peninsula.[26]
- 12:00 UTC (2:00 a.m. HST) at 15°42′N 146°06′W / 15.7°N 146.1°W / 15.7; -146.1 (Hurricane Ignacio becomes a Category 3 hurricane) – Hurricane Ignacio rapidly strengthens to Category 3 status approximately 655 mi (1,050 km) east-southeast of Hilo, Hawaii.[25]
- 18:00 UTC (8:00 a.m. HST) at 17°54′N 174°48′W / 17.9°N 174.8°W / 17.9; -174.8 (Hurricane Kilo rapidly strengthens to Category 3 status) – Hurricane Kilo explosively intensifies into a Category 3 hurricane roughly 355 mi (570 km) west-northwest of Johnston Island, bypassing Category 2 status entirely.[5]
- 18:00 UTC (8:00 a.m. HST) at 16°06′N 146°36′W / 16.1°N 146.6°W / 16.1; -146.6 (Hurricane Ignacio reaches Category 4 strength) – Hurricane Ignacio rapidly strengthens into a Category 4 hurricane approximately 610 mi (980 km) east-southeast of Hilo, Hawaii.[25]
August 30
- 00:00 UTC (2:00 p.m. HST, August 29) at 18°06′N 175°42′W / 18.1°N 175.7°W / 18.1; -175.7 (Hurricane Kilo becomes a Category 4 hurricane) – Hurricane Kilo strengthens further into a Category 4 hurricane about 420 mi (675 km) west-northwest of Johnston Island.[5]
- 06:00 UTC (8:00 p.m HST, August 29) at 18°18′N 176°24′W / 18.3°N 176.4°W / 18.3; -176.4 (Hurricane Kilo reaches peak intensity) – Hurricane Kilo reaches peak intensity as a Category 4 hurricane approximately 465 mi (750 km) west-northwest of Johnston Island, with sustained winds of 140 mph (220 km/h) and a minimum pressure of 940 mbar (hPa; 27.76 inHg).[5]
- 06:00 UTC (8:00 p.m. HST, August 29) at 17°06′N 147°42′W / 17.1°N 147.7°W / 17.1; -147.7 (Hurricane Ignacio reaches peak intensity) – Simultaneously, Hurricane Ignacio reaches peak intensity as a Category 4 hurricane with winds of 145 mph (230 km/h) and a central pressure of 942 mbar (hPa; 27.82 inHg), roughly 510 mi (820 km) east-southeast of Hilo, Hawaii.[25]
- 18:00 UTC (8:00 a.m. HST) at 18°54′N 177°36′W / 18.9°N 177.6°W / 18.9; -177.6 (Hurricane Kilo weakens back to Category 3 status) – Hurricane Kilo weakens into a Category 3 hurricane about 550 mi (885 km) west-northwest of Johnston Island.[5]
- 18:00 UTC (8:00 a.m. HST) at 18°36′N 148°42′W / 18.6°N 148.7°W / 18.6; -148.7 (Hurricane Ignacio weakens back to Category 3 status) – Hurricane Ignacio weakens back to Category 3 status around 425 mi (685 km) east of Hilo, Hawaii.[25]
August 31
- 12:00 UTC (8:00 a.m. HST) at 20°36′N 150°30′W / 20.6°N 150.5°W / 20.6; -150.5 (Hurricane Ignacio weakens to Category 2 status) – Hurricane Ignacio weakens further into a Category 2 hurricane roughly 305 mi (490 km) east-northeast of Hilo, Hawaii.[25]
- 18:00 UTC (12:00 p.m. MDT) at 11°48′N 111°42′W / 11.8°N 111.7°W / 11.8; -111.7 (Tropical Depression Fourteen-E develops) – Tropical Depression Fourteen-E develops from an elongated area of low pressure about 750 mi (1,205 km) south of Cabo San Lucas, Mexico.[27]
September
September 1
- 06:00 UTC (8:00 p.m. HST, August 31) at 22°36′N 152°36′W / 22.6°N 152.6°W / 22.6; -152.6 (Hurricane Ignacio weakens into a Category 1 hurricane) – Hurricane Ignacio weakens further into a Category 1 hurricane about 255 mi (410 km) northeast of Hilo, Hawaii.[25]
- 12:00 UTC (2:00 a.m. HST) at 23°18′N 179°54′W / 23.3°N 179.9°W / 23.3; -179.9 (Hurricane Kilo crosses the International Date Line) – Last recorded point of Hurricane Kilo east of the International Date Line, roughly 375 mi (605 km) south-southwest of Midway Atoll. Within the next six hours, Kilo crosses the International Date Line as a Category 3 hurricane, becoming a Western Pacific typhoon.[5]
- 12:00 UTC (5:00 a.m. PDT) at 16°36′N 139°36′W / 16.6°N 139.6°W / 16.6; -139.6 (Hurricane Jimena weakens to a Category 3 hurricane) – After spending 56 hours at Category 4 strength, Hurricane Jimena weakens to Category 3 status around 1,040 mi (1,670 km) east-southeast of Hilo, Hawaii. Shortly afterwards, Jimena crosses 140°W and enters the Central Pacific basin.[26]
- 18:00 UTC (12:00 p.m. MDT) at 13°06′N 113°54′W / 13.1°N 113.9°W / 13.1; -113.9 (Tropical Depression Fourteen-E becomes Tropical Storm Kevin) – Tropical Depression Fourteen-E strengthens into Tropical Storm Kevin approximately 725 mi (1,165 km) south-southwest of Cabo San Lucas, Mexico.[27]
September 2
- 00:00 UTC (2:00 p.m. HST, September 1) at 24°12′N 155°00′W / 24.2°N 155.0°W / 24.2; -155.0 (Hurricane Ignacio weakens to a tropical storm) – Hurricane Ignacio degrades to a tropical storm around 270 mi (435 km) northeast of Honolulu, Hawaii.[25]
- 12:00 UTC (2:00 a.m. HST) at 17°36′N 142°24′W / 17.6°N 142.4°W / 17.6; -142.4 (Hurricane Jimena weakens to Category 2 strength) – Hurricane Jimena weakens to a Category 2 hurricane roughly 845 mi (1,355 km) east of Hilo, Hawaii.[26]
- 18:00 UTC (8:00 a.m. HST) at 26°24′N 157°42′W / 26.4°N 157.7°W / 26.4; -157.7 (Tropical Storm Ignacio restrengthens into a hurricane) – Tropical Storm Ignacio restrengthens into a Category 1 hurricane about 350 mi (565 km) north of Honolulu, Hawaii.[25]
September 3
- 18:00 UTC (8:00 a.m. HST) at 29°06′N 162°06′W / 29.1°N 162.1°W / 29.1; -162.1 (Hurricane Ignacio weakens to a tropical storm again) – Hurricane Ignacio weakens to a tropical storm once again, approximately 600 mi (965 km) north-northwest of Honolulu, Hawaii.[25]
- 18:00 UTC (11:00 a.m. CDT) at 18°30′N 115°48′W / 18.5°N 115.8°W / 18.5; -115.8 (Tropical Storm Kevin reaches its peak intensity) – Tropical Storm Kevin reaches its peak intensity with winds of 60 mph (95 km/h) and a pressure of 998 mbar (hPa; 29.47 inHg) roughly 485 mi (780 km) southwest of Cabo San Lucas, Mexico.[27]
September 4
- 06:00 UTC (8:00 p.m. HST, September 3) at 19°24′N 144°36′W / 19.4°N 144.6°W / 19.4; -144.6 (Hurricane Jimena weakens to Category 1 strength) – Hurricane Jimena drops to Category 1 status about 685 mi (1,100 km) east of Hilo, Hawaii.[26]
- September 5
- 00:00 UTC (2:00 p.m. HST, September 4) at 34°48′N 164°24′W / 34.8°N 164.4°W / 34.8; -164.4 (Tropical Storm Ignacio becomes a post-tropical cyclone) – Tropical Storm Ignacio degenerates into a post-tropical cyclone around 1,005 mi (1,620 km) north-northwest of Honolulu, Hawaii.[25]
- 06:00 UTC (12:00 a.m. MDT) at 22°48′N 114°36′W / 22.8°N 114.6°W / 22.8; -114.6 (Tropical Storm Kevin weakens to a tropical depression) – Tropical Storm Kevin weakens to a tropical depression about 300 mi (485 km) west of Cabo San Lucas, Mexico.[27]
- 12:00 UTC (6:00 a.m. MDT) at 23°12′N 114°18′W / 23.2°N 114.3°W / 23.2; -114.3 (Tropical Depression Kevin degenerates into a remnant low) – Tropical Depression Kevin degenerates into a remnant low roughly 275 mi (445 km) west of Cabo San Lucas, Mexico.[27]
- 18:00 UTC (8:00 a.m. HST) at 21°30′N 146°30′W / 21.5°N 146.5°W / 21.5; -146.5 (Hurricane Jimena weakens to a tropical storm) – Hurricane Jimena degrades to a tropical storm around 570 mi (915 km) east-northeast of Hilo, Hawaii.[26]
- 18:00 UTC (12:00 p.m. MDT) at 12°06′N 106°18′W / 12.1°N 106.3°W / 12.1; -106.3 (Tropical Depression Fifteen-E develops) – Tropical Depression Fifteen-E develops from a well-defined low approximately 490 mi (790 km) southwest of Manzanillo, Mexico.[28]
September 6
- 06:00 UTC (12:00 a.m. MDT) at 13°12′N 107°48′W / 13.2°N 107.8°W / 13.2; -107.8 (Tropical Depression Fifteen-E becomes Tropical Storm Linda) – Tropical Depression Fifteen-E strengthens into Tropical Storm Linda roughly 520 mi (835 km) southwest of Manzanillo, Mexico.[28]
September 7
- 06:00 UTC (12:00 a.m. MDT) at 16°18′N 111°00′W / 16.3°N 111.0°W / 16.3; -111.0 (Tropical Storm Linda intensifies into a hurricane) – Tropical Storm Linda reaches Category 1 hurricane status roughly 165 mi (265 km) south of Socorro Island.[28]
- 12:00 UTC (6:00 a.m. MDT) at 17°12′N 111°42′W / 17.2°N 111.7°W / 17.2; -111.7 (Hurricane Linda reaches Category 2 status) – Hurricane Linda strengthens to Category 2 status about 115 mi (185 km) south-southwest of Socorro Island.[28]
September 8
- 12:00 UTC (6:00 a.m. MDT) at 20°36′N 113°36′W / 20.6°N 113.6°W / 20.6; -113.6 (Hurricane Linda reaches Category 3 status and its peak strength) – Hurricane Linda intensifies into a Category 3 roughly 210 mi (340 km) northwest of Socorro Island. It simultaneously reaches its peak strength with winds of 125 mph (205 km/h) and a pressure of 950 mbar (hPa; 28.05 inHg).[28]
September 9
- 06:00 UTC (11:00 p.m. PDT, September 8) at 22°48′N 115°54′W / 22.8°N 115.9°W / 22.8; -115.9 (Hurricane Linda weakens to Category 2 status) – Hurricane Linda degrades to Category 2 status, entering a rapid weakening phase over cooler waters, approximately 385 mi (620 km) west of Cabo San Lucas, Mexico.[28]
- 12:00 UTC (2:00 a.m. HST) at 25°30′N 155°12′W / 25.5°N 155.2°W / 25.5; -155.2 (Tropical Storm Jimena weakens to a tropical depression) – Tropical Storm Jimena weakens into a tropical depression about 335 mi (540 km) north-northeast of Honolulu, Hawaii.[26]
- 12:00 UTC (5:00 a.m. PDT) at 23°24′N 116°24′W / 23.4°N 116.4°W / 23.4; -116.4 (Hurricane Linda weakens to Category 1 status) – Hurricane Linda weakens to a Category 1 hurricane roughly 415 mi (670 km) west-northwest of Cabo San Lucas, Mexico.[28]
- 18:00 UTC (11:00 a.m. PDT) at 24°00′N 117°00′W / 24.0°N 117.0°W / 24.0; -117.0 (Hurricane Linda weakens to a tropical storm) – Hurricane Linda weakens to a tropical storm about 455 mi (730 km) west-northwest of Cabo San Lucas, Mexico.[28]
September 10
- 00:00 UTC (2:00 p.m. HST, September 9) at 24°42′N 156°48′W / 24.7°N 156.8°W / 24.7; -156.8 (Tropical Depression Jimena becomes a remnant low) – Tropical Depression Jimena degenerates into a remnant low approximately 230 mi (370 km) north-northeast of Honolulu, Hawaii.[26]
- 12:00 UTC (5:00 a.m. PDT) at 25°42′N 118°24′W / 25.7°N 118.4°W / 25.7; -118.4 (Tropical Storm Linda degenerates into a remnant low) – Tropical Storm Linda degenerates into a non-convective remnant low roughly 570 mi (915 km) northwest of Cabo San Lucas, Mexico.[28]
September 18
- 18:00 UTC (8:00 a.m. HST) at 17°12′N 176°00′W / 17.2°N 176.0°W / 17.2; -176.0 (Tropical Depression Five-C develops) – Tropical Depression Five-C develops roughly 1,210 mi (1,945 km) west-southwest of Honolulu, Hawaii.[29]
September 20
- 18:00 UTC (12:00 p.m. MDT) at 24°18′N 113°42′W / 24.3°N 113.7°W / 24.3; -113.7 (Tropical Depression Sixteen-E forms) – Tropical Depression Sixteen-E forms about 105 mi (170 km) west-southwest of San Carlos, Mexico.[30]
September 21
- 00:00 UTC (2:00 p.m. HST, September 20) at 23°06′N 172°30′W / 23.1°N 172.5°W / 23.1; -172.5 (Tropical Depression Five-C becomes Tropical Storm Malia) – Tropical Depression Five-C strengthens into Tropical Storm Malia about 190 mi (305 km) south of Laysan, Hawaii.[29]
- 04:45 UTC (10:45 p.m. MDT, September 20) at 26°36′N 113°06′W / 26.6°N 113.1°W / 26.6; -113.1 (Tropical Depression Sixteen-E makes landfall near Punta Abreojos, Mexico) – Tropical Depression Sixteen-E makes its first landfall near Punta Abreojos in Baja California Sur, with winds of 35 mph (55 km/h) and a minimum pressure of 1001 mbar (hPa; 29.56 inHg).[30]
- 12:00 UTC (2:00 a.m. HST) at 25°12′N 171°24′W / 25.2°N 171.4°W / 25.2; -171.4 (Tropical Storm Malia reaches its peak strength) – Tropical Storm Malia reaches its peak intensity with winds of 50 mph (85 km/h) and a pressure of 992 mbar (hPa; 29.29 inHg) roughly 45 mi (70 km) southeast of Laysan, Hawaii.[29]
- 13:45 UTC (7:45 a.m. MDT) at 28°48′N 112°18′W / 28.8°N 112.3°W / 28.8; -112.3 (Tropical Depression Sixteen-E makes landfall near Isla Tiburón, Mexico) – Tropical Depression Sixteen-E makes its second landfall near Isla Tiburón in Sonora, with winds of 35 mph (55 km/h) and a minimum pressure of 1002 mbar (hPa; 29.59 inHg).[30]
- 15:00 UTC (9:00 a.m. MDT) at 29°12′N 112°12′W / 29.2°N 112.2°W / 29.2; -112.2 (Tropical Depression Sixteen-E makes landfall near Punta Chueca, Mexico) – Tropical Depression Sixteen-E makes its third landfall near Punta Chueca in Sonora, with winds of 35 mph (55 km/h) and a minimum pressure of 1003 mbar (hPa; 29.62 inHg).[30]
- 18:00 UTC (12:00 p.m. MDT) – Tropical Depression Sixteen-E dissipates over Sonora, though its remnants continue moving northeastwards and later enter the Southwestern United States.[30]
September 22
- 18:00 UTC (8:00 a.m. HST) at 29°18′N 173°18′W / 29.3°N 173.3°W / 29.3; -173.3 (Tropical Storm Malia degenerates into a remnant low) – Tropical Storm Malia degenerates into a remnant low about 260 mi (420 km) north-northwest of Laysan, Hawaii.[29]
September 25

- 00:00 UTC (2:00 p.m. HST, September 24) at 14°00′N 149°06′W / 14.0°N 149.1°W / 14.0; -149.1 (Tropical Depression Six-C develops) – Tropical Depression Six-C develops roughly 560 mi (900 km) southeast of Hilo, Hawaii.[31]
- 06:00 UTC (8:00 p.m. HST, September 24) at 14°24′N 149°24′W / 14.4°N 149.4°W / 14.4; -149.4 (Tropical Depression Six-C becomes Tropical Storm Niala) – Tropical Depression Six-C strengthens into Tropical Storm Niala about 525 mi (845 km) southeast of Hilo, Hawaii.[31]
September 26
- 18:00 UTC (8:00 a.m. HST) at 17°06′N 151°54′W / 17.1°N 151.9°W / 17.1; -151.9 (Tropical Storm Niala reaches its peak strength) – Tropical Storm Niala reaches its peak intensity with winds of 65 mph (100 km/h) and a pressure of 992 mbar (hPa; 29.29 inHg) approximately 275 mi (445 km) southeast of Hilo, Hawaii.[31]
- 18:00 UTC (1:00 p.m. CDT) at 13°06′N 103°00′W / 13.1°N 103.0°W / 13.1; -103.0 (Tropical Depression Seventeen-E forms) – Tropical Depression Seventeen-E forms from a tropical wave about 335 mi (540 km) southwest of Acapulco, Mexico.[32]
September 27
- 00:00 UTC (7:00 p.m. CDT, September 26) at 13°36′N 103°06′W / 13.6°N 103.1°W / 13.6; -103.1 (Tropical Depression Seventeen-E becomes Tropical Storm Marty) – Tropical Depression Seventeen-E develops into Tropical Storm Marty roughly 310 mi (500 km) southwest of Acapulco, Mexico.[32]
September 28
- 12:00 UTC (2:00 a.m. HST) at 15°00′N 156°36′W / 15.0°N 156.6°W / 15.0; -156.6 (Tropical Storm Niala weakens to a tropical depression) – Tropical Storm Niala weakens to a tropical depression about 440 mi (710 km) south of Honolulu, Hawaii.[31]
- 12:00 UTC (7:00 a.m. CDT) at 16°18′N 103°00′W / 16.3°N 103.0°W / 16.3; -103.0 (Tropical Storm Marty becomes a hurricane) – Tropical Storm Marty becomes a Category 1 hurricane around 220 mi (355 km) west of Acapulco, Mexico.[32]
- 18:00 UTC (1:00 p.m. CDT) at 16°36′N 102°24′W / 16.6°N 102.4°W / 16.6; -102.4 (Hurricane Marty peaks in intensity) – Hurricane Marty reaches peak intensity approximately 170 mi (275 km) west of Acapulco, Mexico, possessing sustained winds of 80 mph (130 km/h) and a central pressure of 987 mbar (hPa; 29.15 inHg).[32]
September 29
- 00:00 UTC (2:00 p.m. HST, September 28) at 15°24′N 158°24′W / 15.4°N 158.4°W / 15.4; -158.4 (Tropical Depression Niala degenerates into a remnant low) – Tropical Depression Niala degenerates into a remnant low roughly 410 mi (660 km) south of Honolulu, Hawaii.[31]
- 06:00 UTC (1:00 a.m. CDT) at 16°18′N 101°54′W / 16.3°N 101.9°W / 16.3; -101.9 (Hurricane Marty weakens to a tropical storm) – Hurricane Marty weakens back to a tropical storm about 140 mi (225 km) west-southwest of Acapulco, Mexico.[32]
September 30
- 06:00 UTC (1:00 a.m. CDT) at 16°06′N 101°42′W / 16.1°N 101.7°W / 16.1; -101.7 (Tropical Storm Marty degenerates into a post-tropical cyclone) – Tropical Storm Marty degenerates into a non-convective post-tropical cyclone about 130 mi (210 km) west-southwest of Acapulco, Mexico.[32]
October
October 3
- 06:00 UTC (8:00 p.m. HST, October 2) at 12°30′N 155°24′W / 12.5°N 155.4°W / 12.5; -155.4 (Tropical Depression Seven-C develops) – Tropical Depression Seven-C develops about 445 mi (715 km) south of Ka Lae, Hawaii.[33] The twelfth tropical cyclone to form in or cross into the Central Pacific during 2015, this marks the highest number of systems in the basin during the satellite era.[34]
- 06:00 UTC (8:00 p.m. HST, October 2) at 12°18′N 171°30′W / 12.3°N 171.5°W / 12.3; -171.5 (Tropical Depression Eight-C develops) – Tropical Depression Eight-C develops roughly 335 mi (540 km) south-southwest of Johnston Island. It simultaneously reaches its peak strength with winds of 35 mph (55 km/h) and a pressure of 1001 mbar (hPa; 29.56 inHg).[35]
- 12:00 UTC (2:00 a.m. HST) at 12°36′N 155°12′W / 12.6°N 155.2°W / 12.6; -155.2 (Tropical Depression Seven-C becomes Tropical Storm Oho) – Tropical Depression Seven-C strengthens into Tropical Storm Oho roughly 435 mi (700 km) south of Ka Lae, Hawaii.[33]
October 4
- 06:00 UTC (8:00 p.m. HST, October 3) at 10°42′N 171°36′W / 10.7°N 171.6°W / 10.7; -171.6 (Tropical Depression Eight-C dissipates) – Tropical Depression Eight-C degenerates into a post-tropical low about 440 mi (710 km) south-southwest of Johnston Island.[35]
October 6
- 12:00 UTC (2:00 a.m. HST) at 15°06′N 151°54′W / 15.1°N 151.9°W / 15.1; -151.9 (Tropical Storm Oho attains hurricane status) – Tropical Storm Oho strengthens into a hurricane roughly 380 mi (610 km) southeast of Hilo, Hawaii.[33]
October 7
- 06:00 UTC (8:00 p.m. HST, October 6) at 19°06′N 147°54′W / 19.1°N 147.9°W / 19.1; -147.9 (Hurricane Oho reaches Category 2 status) – Hurricane Oho reaches Category 2 status about 470 mi (755 km) east of Hilo, Hawaii.[33]
- 12:00 UTC (2:00 a.m. HST) at 21°54′N 146°36′W / 21.9°N 146.6°W / 21.9; -146.6 (Hurricane Oho attains its peak intensity) – Hurricane Oho reaches its peak intensity with winds of 110 mph (175 km/h) and a pressure of 957 mbar (hPa; 28.26 inHg) approximately 570 mi (915 km) east-northeast of Hilo, Hawaii.[33]
October 8
- 00:00 UTC (2:00 p.m. HST, October 7) at 28°48′N 145°12′W / 28.8°N 145.2°W / 28.8; -145.2 (Hurricane Oho weakens to Category 1 status) – Hurricane Oho weakens to Category 1 status about 885 mi (1,425 km) northeast of Hilo, Hawaii.[33]
- 12:00 UTC (2:00 a.m. HST) at 33°18′N 142°30′W / 33.3°N 142.5°W / 33.3; -142.5 (Hurricane Oho transitions into an extratropical cyclone) – Hurricane Oho transitions into an extratropical cyclone, with winds falling below hurricane-force, roughly 1,220 mi (1,960 km) northeast of Hilo, Hawaii.[33]
October 9
- 12:00 UTC (5:00 a.m. PDT) at 10°48′N 131°36′W / 10.8°N 131.6°W / 10.8; -131.6 (Tropical Depression Eighteen-E develops) – Tropical Depression Eighteen-E develops from a broad area of low pressure about 1,680 mi (2,705 km) southeast of Hilo, Hawaii.[36]
October 10
- 00:00 UTC (5:00 p.m. PDT, October 9) at 11°06′N 134°30′W / 11.1°N 134.5°W / 11.1; -134.5 (Tropical Depression Eighteen-E becomes Tropical Storm Nora) – Tropical Depression Eighteen-E strengthens into Tropical Storm Nora roughly 1,495 mi (2,405 km) southeast of Hilo, Hawaii.[36]
October 11
- 06:00 UTC (8:00 p.m. HST, October 10) – Tropical Storm Nora crosses west of 140°W and enters the Central Pacific basin.[36]
October 12
- 00:00 UTC (2:00 p.m. HST, October 11) at 12°18′N 143°30′W / 12.3°N 143.5°W / 12.3; -143.5 (Tropical Storm Nora attains its peak strength) – Tropical Storm Nora reaches its peak intensity with winds of 70 mph (110 km/h) and a pressure of 993 mbar (hPa; 29.32 inHg) about 925 mi (1,490 km) southeast of Hilo, Hawaii.[36]
October 14
- 06:00 UTC (8:00 p.m. HST, October 13) at 14°48′N 150°24′W / 14.8°N 150.4°W / 14.8; -150.4 (Tropical Storm Nora weakens to a tropical depression) – Tropical Storm Nora weakens to a tropical depression roughly 460 mi (740 km) southeast of Hilo, Hawaii.[36]
October 15
- 00:00 UTC (6:00 p.m. MDT, October 14) at 10°12′N 117°00′W / 10.2°N 117.0°W / 10.2; -117.0 (Tropical Depression Nineteen-E forms) – Tropical Depression Nineteen-E forms from a broad area of low pressure around 990 mi (1,595 km) south-southwest of Cabo San Lucas, Mexico.[37]
- 18:00 UTC (8:00 a.m. HST) at 16°36′N 152°42′W / 16.6°N 152.7°W / 16.6; -152.7 (Tropical Depression Nora degenerates into a remnant low) – Tropical Depression Nora degenerates into a remnant low about 265 mi (425 km) southeast of Hilo, Hawaii.[36]
October 17
- 00:00 UTC (5:00 p.m. PDT, October 16) at 9°24′N 126°48′W / 9.4°N 126.8°W / 9.4; -126.8 (Tropical Depression Nineteen-E develops into Tropical Storm Olaf) – Tropical Depression Nineteen-E strengthens into Tropical Storm Olaf about 1,455 mi (2,340 km) southwest of the southern tip of the Baja California Peninsula.[37]
October 18
- 06:00 UTC (11:00 p.m. PDT, October 17) at 9°18′N 131°36′W / 9.3°N 131.6°W / 9.3; -131.6 (Tropical Storm Olaf becomes a hurricane) – Tropical Storm Olaf intensifies into a Category 1 hurricane roughly 1,715 mi (2,760 km) west-southwest of the southern tip of the Baja California Peninsula, becoming the lowest-latitude hurricane on record in the Eastern Pacific.[37]
October 19
- 00:00 UTC (5:00 p.m. PDT, October 18) at 9°36′N 135°00′W / 9.6°N 135.0°W / 9.6; -135.0 (Hurricane Olaf reaches Category 2 strength) – Hurricane Olaf intensifies into a Category 2 hurricane about 1,895 mi (3,050 km) west-southwest of the southern tip of the Baja California Peninsula.[37]
- 12:00 UTC (5:00 a.m. PDT) at 9°48′N 137°12′W / 9.8°N 137.2°W / 9.8; -137.2 (Hurricane Olaf rapidly reaches Category 3 strength) – Hurricane Olaf rapidly strengthens into a Category 3 hurricane approximately 2,015 mi (3,245 km) west-southwest of the southern tip of the Baja California Peninsula. This gives Olaf the further distinction of being the lowest-latitude major hurricane on record in the Eastern Pacific.[37]
- 18:00 UTC (11:00 a.m. PDT) at 9°54′N 138°12′W / 9.9°N 138.2°W / 9.9; -138.2 (Hurricane Olaf rapidly reaches Category 4 strength) – Hurricane Olaf rapidly strengthens into a Category 4 hurricane around 2,070 mi (3,335 km) west-southwest of the southern tip of the Baja California Peninsula.[37]
October 20
- 06:00 UTC (8:00 p.m. HST, October 19) at 10°12′N 140°00′W / 10.2°N 140.0°W / 10.2; -140.0 (Hurricane Olaf reaches peak intensity) – Hurricane Olaf crosses into the Central Pacific basin and concurrently reaches peak intensity with winds of 150 mph (240 km/h) and a minimum pressure of 938 mbar (hPa; 27.70 inHg), while located about 1,200 mi (1,935 km) east-southeast of Hilo, Hawaii.[37]
- 06:00 UTC (1:00 a.m. CDT) at 13°24′N 94°00′W / 13.4°N 94.0°W / 13.4; -94.0 (Tropical Depression Twenty-E develops) – Tropical Depression Twenty-E develops approximately 205 mi (330 km) south-southeast of Salina Cruz, Mexico.[38]
October 21
- 00:00 UTC (7:00 p.m. CDT, October 20) at 13°06′N 95°06′W / 13.1°N 95.1°W / 13.1; -95.1 (Tropical Depression Twenty-E becomes Tropical Storm Patricia) – Tropical Depression Twenty-E strengthens into Tropical Storm Patricia roughly 215 mi (345 km) south of Salina Cruz, Mexico.[38]
- 12:00 UTC (2:00 a.m. HST) at 11°36′N 144°06′W / 11.6°N 144.1°W / 11.6; -144.1 (Hurricane Olaf drops to Category 3 strength) – Hurricane Olaf weakens to Category 3 status around 920 mi (1,480 km) southeast of Hilo, Hawaii.[37]
October 22
- 06:00 UTC (1:00 a.m. CDT) at 14°00′N 101°42′W / 14.0°N 101.7°W / 14.0; -101.7 (Tropical Storm Patricia strengthens into a hurricane) – Tropical Storm Patricia reaches Category 1 hurricane status about 230 mi (370 km) southwest of Acapulco, Mexico.[38]
- 12:00 UTC (7:00 a.m. CDT) at 14°36′N 103°06′W / 14.6°N 103.1°W / 14.6; -103.1 (Hurricane Patricia reaches Category 2 status) – Hurricane Patricia rapidly strengthens to Category 2 status roughly 315 mi (505 km) south of Manzanillo, Mexico.[38]
- 18:00 UTC (8:00 a.m. HST) at 13°30′N 146°18′W / 13.5°N 146.3°W / 13.5; -146.3 (Hurricane Olaf weakens to Category 2 strength) – Hurricane Olaf briefly weakens to Category 2 status approximately 725 mi (1,165 km) southeast of Hilo, Hawaii.[37]
- 18:00 UTC (1:00 p.m. CDT) at 15°12′N 104°12′W / 15.2°N 104.2°W / 15.2; -104.2 (Hurricane Patricia reaches Category 4 status) – Hurricane Patricia explosively intensifies to Category 4 status roughly 265 mi (425 km) south of Manzanillo, Mexico.[38]
October 23

- 00:00 UTC (2:00 p.m. HST, October 22) at 14°00′N 146°18′W / 14.0°N 146.3°W / 14.0; -146.3 (Hurricane Olaf regains Category 3 strength) – Hurricane Olaf reattains Category 3 strength about 700 mi (1,130 km) southeast of Hilo, Hawaii.[37]
- 00:00 UTC (7:00 p.m. CDT, October 22) at 15°48′N 104°54′W / 15.8°N 104.9°W / 15.8; -104.9 (Hurricane Patricia reaches Category 5 status) – Hurricane Patricia continues to explosively intensify and attains Category 5 status roughly 225 mi (360 km) south-southwest of Manzanillo, Mexico.[38]
- 12:00 UTC (7:00 a.m. CDT) at 17°18′N 105°36′W / 17.3°N 105.6°W / 17.3; -105.6 (Hurricane Patricia attains its peak intensity) – Hurricane Patricia reaches its peak intensity with winds of 215 mph (345 km/h) and a pressure of 872 mbar (hPa; 25.75 inHg) approximately 150 mi (240 km) southwest of Manzanillo, Mexico. This ranks Patricia as the strongest tropical cyclone ever observed in the Western Hemisphere, surpassing Atlantic Hurricane Wilma in 2005 which attained a pressure of 882 mbar (hPa; 26.05 inHg). It is also the second-most intense tropical cyclone on record worldwide, just shy of Typhoon Tip in 1979 which attained a pressure of 870 mbar (hPa; 25.69 inHg).[38]
- 23:00 UTC (6:00 p.m. CDT) at 19°24′N 105°00′W / 19.4°N 105.0°W / 19.4; -105.0 (Hurricane Patricia makes landfall near Cuixmala, Mexico) – Hurricane Patricia rapidly weakens and makes landfall near Cuixmala, Mexico, as a Category 4 hurricane with winds of 150 mph (240 km/h) and a pressure of 932 mbar (hPa; 27.52 inHg).
October 24
- 00:00 UTC (7:00 p.m. CDT, October 23) at 19°36′N 104°54′W / 19.6°N 104.9°W / 19.6; -104.9 (Hurricane Patricia weakens to Category 3 status) – Hurricane Patricia weakens to Category 3 status roughly 85 mi (135 km) north-northwest of Manzanillo, Mexico.
- 03:00 UTC (10:00 p.m. CDT, October 23) at 20°12′N 104°36′W / 20.2°N 104.6°W / 20.2; -104.6 (Hurricane Patricia weakens to tropical storm status) – Hurricane Patricia rapidly weakens to a tropical storm about 85 mi (135 km) west-southwest of Guadalajara, Mexico.[38][39]
- 12:00 UTC (7:00 a.m. CDT) at 23°12′N 102°18′W / 23.2°N 102.3°W / 23.2; -102.3 (Tropical Storm Patricia weakens to a tropical depression) – Tropical Storm Patricia weakens to a tropical depression roughly 90 mi (145 km) north of Aguascalientes City, Mexico.[38]
- Before 18:00 UTC (1:00 p.m. CDT) – Tropical Depression Patricia dissipates over central Mexico.[38]
- 18:00 UTC (8:00 a.m. HST) at 19°42′N 145°06′W / 19.7°N 145.1°W / 19.7; -145.1 (Hurricane Olaf weakens to Category 2 strength) – Hurricane Olaf weakens back to Category 2 status approximately 650 mi (1,045 km) east of Hilo, Hawaii.[37]
October 25
- 06:00 UTC (8:00 p.m. HST, October 24) at 20°48′N 144°12′W / 20.8°N 144.2°W / 20.8; -144.2 (Hurricane Olaf drops to Category 1 status) – Hurricane Olaf weakens further to Category 1 strength approximately 710 mi (1,140 km) east of Hilo, Hawaii.[37]
October 26
- 12:00 UTC (2:00 a.m. HST) at 24°24′N 141°30′W / 24.4°N 141.5°W / 24.4; -141.5 (Hurricane Olaf weakens to a tropical storm) – Hurricane Olaf weakens into a tropical storm approximately 1,580 mi (2,545 km) west-southwest of San Diego, California.[37]
- 18:00 UTC (8:00 a.m. HST) at 25°18′N 139°30′W / 25.3°N 139.5°W / 25.3; -139.5 (Tropical Olaf reenters the Eastern Pacific) – Tropical Storm Olaf crosses 140°W from the west and reenters the Eastern Pacific basin roughly 1,440 mi (2,320 km) west-southwest of San Diego, California. This makes Olaf the first tropical cyclone to cross from the Eastern Pacific into the Central Pacific and back into the Eastern Pacific on record.[37]
October 27
- 12:00 UTC (2:00 a.m. HST) at 26°36′N 135°30′W / 26.6°N 135.5°W / 26.6; -135.5 (Tropical Storm Olaf becomes post-tropical) – Tropical Storm Olaf degenerates into a post-tropical cyclone about 1,180 mi (1,900 km) west-southwest of San Diego, California.[37]
November
November 18
- 12:00 UTC (5:00 a.m. MST) at 12°54′N 106°54′W / 12.9°N 106.9°W / 12.9; -106.9 (Tropical Depression Twenty-One-E develops) – Tropical Depression Twenty-One-E forms approximately 455 mi (730 km) south-southwest of Manzanillo, Mexico.[40]
November 19
- 12:00 UTC (5:00 a.m. MST) at 14°12′N 106°06′W / 14.2°N 106.1°W / 14.2; -106.1 (Tropical Depression Twenty-One-E becomes Tropical Storm Rick) – Tropical Depression Twenty-One-E strengthens into Tropical Storm Rick about 355 mi (570 km) south-southwest of Manzanillo, Mexico. It simultaneously reaches its peak strength with winds of 40 mph (65 km/h) and a pressure of 1002 mbar (hPa; 29.59 inHg).[40]
November 22
- 06:00 UTC (10:00 p.m. PST, November 21) at 17°00′N 117°30′W / 17.0°N 117.5°W / 17.0; -117.5 (Tropical Storm Rick weakens to a tropical depression) – Tropical Storm Rick weakens to a tropical depression roughly 640 mi (1,030 km) southwest of Cabo San Lucas, Mexico.[40]
- 18:00 UTC (10:00 a.m. PST) at 17°48′N 118°54′W / 17.8°N 118.9°W / 17.8; -118.9 (Tropical Depression Rick degenerates to a remnant low) – Tropical Depression Rick degenerates to a remnant low about 675 mi (1,085 km) west-southwest of Cabo San Lucas, Mexico.[40]
November 23

- 18:00 UTC (12:00 p.m. CST) at 10°48′N 102°00′W / 10.8°N 102.0°W / 10.8; -102.0 (Tropical Depression Twenty-Two-E develops) – Tropical Depression Twenty-Two-E forms approximately 440 mi (710 km) south-southwest of Acapulco, Mexico.[41]
November 24
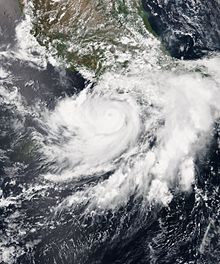
- 00:00 UTC (6:00 p.m. CST, November 23) at 10°48′N 103°18′W / 10.8°N 103.3°W / 10.8; -103.3 (Tropical Depression Twenty-Two-E becomes Tropical Storm Sandra) – Tropical Depression Twenty-Two-E strengthens into Tropical Storm Sandra about 575 mi (925 km) south of Manzanillo, Mexico.[41]
November 25
- 06:00 UTC (11:00 p.m. MST, November 24) at 12°06′N 108°30′W / 12.1°N 108.5°W / 12.1; -108.5 (Tropical Storm Sandra intensifies into a hurricane) – Tropical Storm Sandra strengthens to a Category 1 hurricane approximately 555 mi (895 km) south-southwest of Manzanillo, Mexico.[41]
- 12:00 UTC (5:00 a.m. MST) at 12°18′N 109°18′W / 12.3°N 109.3°W / 12.3; -109.3 (Hurricane Sandra reaches Category 2 status) – Hurricane Sandra rapidly strengthens into a Category 2 hurricane about 570 mi (915 km) southwest of Manzanillo, Mexico.[41]
November 26
- 00:00 UTC (5:00 p.m. MST, November 25) at 13°18′N 110°12′W / 13.3°N 110.2°W / 13.3; -110.2 (Hurricane Sandra reaches Category 3 status) – Hurricane Sandra reaches Category 3 status roughly 555 mi (895 km) southwest of Manzanillo, Mexico, becoming the latest-forming major hurricane in the Northeastern Pacific on record.[41]
- 06:00 UTC (11:00 p.m. MST, November 25) at 14°06′N 110°12′W / 14.1°N 110.2°W / 14.1; -110.2 (Hurricane Sandra reaches Category 4 status) – Hurricane Sandra rapidly strengthens into a Category 4 hurricane about 530 mi (855 km) southwest of Cabo Corrientes, Mexico. It simultaneously reaches its peak strength with winds of 150 mph (240 km/h) and a pressure of 934 mbar (hPa; 27.58 inHg).[41]
November 27
- 00:00 UTC (5:00 p.m. MST, November 26) at 17°24′N 109°48′W / 17.4°N 109.8°W / 17.4; -109.8 (Hurricane Sandra weakens to Category 3 status) – Hurricane Sandra weakens to a Category 3 hurricane roughly 380 mi (610 km) south of the southern tip of the Baja California Peninsula.[41]
- 06:00 UTC (11:00 p.m. MST, November 26) at 18°30′N 109°18′W / 18.5°N 109.3°W / 18.5; -109.3 (Hurricane Sandra rapidly weakens to Category 2 status) – Hurricane Sandra rapidly weakens to a Category 2 hurricane approximately 305 mi (490 km) south of the southern tip of the Baja California Peninsula.[41]
- 18:00 UTC (11:00 a.m. MST) at 20°00′N 108°12′W / 20.0°N 108.2°W / 20.0; -108.2 (Hurricane Sandra weakens to Category 1 status) – Hurricane Sandra weakens to a Category 1 hurricane about 150 mi (240 km) southwest of Islas Marías.[10]
November 28
- 00:00 UTC (5:00 p.m. MST, November 27) at 20°42′N 108°48′W / 20.7°N 108.8°W / 20.7; -108.8 (Hurricane Sandra rapidly weakens to a tropical storm) – Hurricane Sandra rapidly weakens to a tropical storm about 160 mi (255 km) west-southwest of Islas Marías.[41]
- 06:00 UTC (11:00 p.m. MST, November 27) at 21°12′N 109°06′W / 21.2°N 109.1°W / 21.2; -109.1 (Tropical Storm Sandra degenerates into a remnant low) – Tropical Storm Sandra degenerates to a remnant low roughly 125 mi (200 km) northeast of Cabo San Lucas, Mexico.[41]
November 30
- The 2015 Pacific hurricane season officially ends.[2]
December
December 31
- 00:00 UTC (2:00 p.m. HST, December 30) at 2°12′N 175°30′W / 2.2°N 175.5°W / 2.2; -175.5 (Tropical Depression Nine-C develops) – Tropical Depression Nine-C develops about 1,080 mi (1,740 km) south-southwest of Johnston Island. Simultaneously, the depression reaches peak intensity with winds of 35 mph (55 km/h) and a minimum pressure of 1001 mbar (hPa; 29.56 inHg).[42]
January 2016
January 1
- 00:00 UTC (2:00 p.m. HST, December 31) at 2°12′N 176°24′W / 2.2°N 176.4°W / 2.2; -176.4 (Tropical Depression Nine-C weakens) – Tropical Depression Nine-C weakens to a remnant low about 1,105 mi (1,780 km) south-southwest of Johnston Island.[42]
See also
 Tropical cyclones portal

Notes
- ^ A major hurricane is a storm that ranks as Category 3 or higher on the Saffir–Simpson hurricane wind scale.[3]
- ^ The figures for maximum sustained winds and position estimates are rounded to the nearest five units (knots, miles, or kilometers), following the convention used in the National Hurricane Center's operational products for each storm. All other units are rounded to the nearest digit.
References
- ^ Kieran Hickey (August 2016). "A review of the 2015 hurricane, tropical cyclone and typhoon season". International Journal of Meteorology. 41 (398): 162–167. Retrieved March 3, 2019.
- ^ a b c Neal Dorst (June 2, 2016). "TCFAQ G1) When is hurricane season?". Atlantic Oceanographic and Meteorological Laboratory. Archived from the original on May 6, 2009. Retrieved July 24, 2018.
- ^ Stan Goldenberg (June 1, 2017). "TCFAQ A3) What is a super-typhoon? What is a major hurricane? What is an intense hurricane?". Atlantic Oceanographic and Meteorological Laboratory. Archived from the original on April 26, 2014. Retrieved May 24, 2018.
- ^ Tropical Weather Summary for the Central North Pacific (Report). Honolulu, Hawaii: Central Pacific Hurricane Center. January 1, 2016. Archived from the original on April 2, 2019. Retrieved March 2, 2019.
- ^ a b c d e f g h i j Thomas Birchard (October 10, 2018). Hurricane Kilo (PDF) (Report). Tropical Cyclone Report. Honolulu, Hawaii: Central Pacific Hurricane Center. Retrieved June 9, 2019.
- ^ Lixion A. Avila (February 26, 2016). 2015 Eastern North Pacific Hurricane Season (PDF) (Report). Annual Summary. Miami, Florida: National Hurricane Center. Retrieved March 2, 2019.
- ^ Chris Brenchley (December 18, 2015). Historic Hurricane Season – 2015 Summary for the Central Pacific Basin (PDF) (Report). Honolulu, Hawaii: Central Pacific Hurricane Center. Archived from the original (PDF) on April 2, 2019. Retrieved March 2, 2019.
- ^ Robbie Berg (May 28, 2015). Tropical Depression One-E Discussion Number 1 (Report). Miami, Florida: National Hurricane Center. Retrieved June 27, 2015.
- ^ "About the Central Pacific Hurricane Center". National Oceanographic and Atmospheric Administration. Retrieved August 18, 2019.
- ^ a b c d e f g h i j k l m Michael J. Brennan (August 6, 2015). Hurricane Andres (PDF) (Report). Tropical Cyclone Report. Miami, Florida: National Hurricane Center. Retrieved December 6, 2015.
- ^ a b c d e f g h i j k l m n o p q r s t Richard J. Pasch & David P. Roberts (November 30, 2015). Hurricane Blanca (PDF) (Report). Tropical Cyclone Report. Miami, Florida: National Hurricane Center. Retrieved December 8, 2015.
- ^ a b Jeff Masters (June 8, 2015). "Tropical Storm Blanca Hits Baja a Month Earlier Than Their Previous Earliest Landfall". Weather Underground. Retrieved September 25, 2019.
- ^ a b c d e f g h i j John L. Beven II & Christopher W. Landsea (October 27, 2015). Hurricane Carlos (PDF) (Report). Tropical Cyclone Report. Miami, Florida: National Hurricane Center. Retrieved December 8, 2015.
- ^ a b c d e Stacy R. Stewart; Thomas Birchard (October 17, 2016). Tropical Storm Ela (PDF) (Report). Tropical Cyclone Report. Honolulu, Hawaii: Central Pacific Hurricane Center. Retrieved November 20, 2016.
- ^ a b c d Derek Wroe (July 9, 2017). Tropical Storm Halola (PDF) (Report). Tropical Cyclone Report. Honolulu, Hawaii: Central Pacific Hurricane Center. Retrieved June 9, 2019.
- ^ a b c d Christopher Jacobson (April 16, 2018). Tropical Storm Iune (PDF) (Report). Tropical Cyclone Report. Honolulu, Hawaii: Central Pacific Hurricane Center. Retrieved June 9, 2019.
- ^ a b c d e f g h i j Todd B. Kimberlain (October 27, 2015). Hurricane Dolores (PDF) (Report). Tropical Cyclone Report. Miami, Florida: National Hurricane Center. Retrieved December 8, 2015.
- ^ a b c d e Daniel P. Brown (September 16, 2015). Tropical Storm Enrique (PDF) (Report). Tropical Cyclone Report. Miami, Florida: National Hurricane Center. Retrieved December 8, 2015.
- ^ a b c d John P. Cangialosi (September 3, 2015). Tropical Storm Felicia (PDF) (Report). Tropical Cyclone Report. Miami, Florida: National Hurricane Center. Retrieved December 8, 2015.
- ^ a b Robbie Berg (September 9, 2015). Tropical Depression Eight-E (PDF) (Report). Tropical Cyclone Report. Miami, Florida: National Hurricane Center. Retrieved December 9, 2015.
- ^ a b c d e f g h i j Lixion A. Avila (September 29, 2015). Hurricane Guillermo (PDF) (Report). Tropical Cyclone Report. Miami, Florida: National Hurricane Center. Retrieved December 8, 2015.
- ^ a b c d e f g h i j k l Eric S. Blake (October 29, 2015). Hurricane Hilda (PDF) (Report). Tropical Cyclone Report. Miami, Florida: National Hurricane Center. Retrieved December 9, 2015.
- ^ a b Richard J. Pasch (February 16, 2016). Tropical Depression Eleven-E (PDF) (Report). Tropical Cyclone Report. Miami, Florida: National Hurricane Center. Retrieved February 27, 2016.
- ^ a b c d e f g h Derek Wroe (August 1, 2017). Hurricane Loke (PDF) (Report). Tropical Cyclone Report. Honolulu, Hawaii: Central Pacific Hurricane Center. Retrieved June 9, 2019.
- ^ a b c d e f g h i j k l m n John L. Beven II; Christopher Jacobson (August 17, 2018). Hurricane Ignacio (PDF) (Report). Tropical Cyclone Report. Miami, Florida and Honolulu, Hawaii: National Hurricane Center. Retrieved August 21, 2018.
- ^ a b c d e f g h i j k l Stacy R. Stewart; Jeffrey Powell (February 4, 2016). Hurricane Jimena (PDF) (Report). Tropical Cyclone Report. Miami, Florida: National Hurricane Center. Retrieved February 9, 2016.
- ^ a b c d e Todd B. Kimberlain (November 28, 2015). Tropical Storm Kevin (PDF) (Report). Tropical Cyclone Report. Miami, Florida: National Hurricane Center. Retrieved December 9, 2015.
- ^ a b c d e f g h i Daniel P. Brown (November 12, 2015). Hurricane Linda (PDF) (Report). Tropical Cyclone Report. Miami, Florida: National Hurricane Center. Retrieved December 9, 2015.
- ^ a b c d Jon Jelsema (June 1, 2016). Tropical Storm Malia (PDF) (Report). Tropical Cyclone Report. Honolulu, Hawaii: Central Pacific Hurricane Center. Archived from the original (PDF) on June 20, 2018. Retrieved June 20, 2018.
- ^ a b c d e John P. Cangialosi (January 11, 2016). Tropical Depression Sixteen-E (PDF) (Report). Tropical Cyclone Report. Miami, Florida: National Hurricane Center. Retrieved January 14, 2016.
- ^ a b c d e Sam Houston; Thomas Birchard (November 16, 2016). Tropical Storm Niala (Report). Tropical Cyclone Report. Honolulu, Hawaii: Central Pacific Hurricane Center. Archived from the original on February 4, 2019. Retrieved January 8, 2017.
- ^ a b c d e f Robbie Berg (January 5, 2016). Hurricane Marty (PDF) (Report). Tropical Cyclone Report. Miami, Florida: National Hurricane Center. Retrieved January 15, 2016.
- ^ a b c d e f g Sam Houston; Derek Wroe (November 21, 2016). Hurricane Oho (Report). Tropical Cyclone Report. Honolulu, Hawaii: Central Pacific Hurricane Center. Archived from the original on September 4, 2018. Retrieved December 23, 2016.
- ^ Thomas Birchard (October 3, 2015). Tropical Depression Seven-C Discussion Number 1 (Report). Honolulu, Hawaii: Central Pacific hurricane Center. Archived from the original on July 18, 2018. Retrieved October 3, 2015.
- ^ a b Christopher Jacobson (October 10, 2017). Tropical Depression Eight-C (PDF) (Report). Tropical Cyclone Report. Honolulu, Hawaii: Central Pacific Hurricane Center. Retrieved June 9, 2019.
- ^ a b c d e f Lixion A. Avila (December 8, 2015). Tropical Storm Nora (PDF) (Report). Tropical Cyclone Report. Miami, Florida: National Hurricane Center. Retrieved December 9, 2015.
- ^ a b c d e f g h i j k l m n o Eric S. Blake; Jon Jelsema (February 9, 2016). Hurricane Olaf (PDF) (Report). Tropical Cyclone Report. Miami, Florida: National Hurricane Center. Retrieved May 7, 2016.
- ^ a b c d e f g h i j Todd B. Kimberlain; Eric S. Blake & John P. Cangialosi (February 4, 2016). Hurricane Patricia (PDF) (Report). Tropical Cyclone Report. Miami, Florida: National Hurricane Center. Retrieved February 9, 2016.
- ^ Eric S. Blake & Stacy R. Stewart (October 24, 2015). Hurricane Patricia Advisory Number 17 (Advisory). Miami, Florida: National Hurricane Center. Retrieved February 9, 2016.
- ^ a b c d John L. Beven II (January 20, 2016). Tropical Storm Rick (PDF) (Report). Tropical Cyclone Report. Miami, Florida: National Hurricane Center. Retrieved February 9, 2016.
- ^ a b c d e f g h i j John L. Beven II (January 29, 2016). Hurricane Sandra (PDF) (Report). Tropical Cyclone Report. Miami, Florida: National Hurricane Center. Retrieved February 9, 2016.
- ^ a b Sam Houston; Thomas Birchard (December 22, 2016). Tropical Depression Nine-C (Report). Tropical Cyclone Report. Honolulu, Hawaii: Central Pacific Hurricane Center. Archived from the original on July 27, 2018. Retrieved January 8, 2017.
External links
Wikimedia Commons has media related to 2015 Pacific hurricane season.
- The National Hurricane Center's 2015 Tropical Cyclone Advisory Archive
- The National Hurricane Center's Tropical Cyclone Reports for the 2015 Eastern Pacific hurricane season
- The Central Pacific Hurricane Center's Tropical Cyclone Reports for the 2015 Central Pacific hurricane season


